To better understand how RabbitMQ and Azure Service Bus behave under load, we ran a series of controlled benchmarks using Python clients. The goal of the benchmark was not to determine a universal winner, but to observe how each system behaves under similar workloads and how factors such as message size and consumer concurrency affect performance.
In the previous article, we compared RabbitMQ and Azure Service Bus from an architectural perspective, including routing, delivery semantics, dead-lettering, protocol support, and operational model. In this follow-up, we test how those differences appear in practice through benchmark measurements.
Test environment
| Component | Environment |
|---|---|
| Azure Service Bus | Premium |
| RabbitMQ | Managed RabbitMQ on CloudAMQP |
| Client language | Python |
| Producer model | Single producer |
| Consumer model | Variable concurrency |
RabbitMQ tests used the Pika client over AMQP 0.9.1, while Azure Service Bus tests used the Azure Service Bus Python SDK over AMQP 1.0. All tests were executed from the same environment to reduce network variability.
Messaging patterns tested
Two messaging patterns were evaluated.
-
Queue (point-to-point) – Producer → Queue → Consumer
- Azure Service Bus: Queue
- RabbitMQ: Queue via default exchange
-
Publish/Subscribe – Producer → Topic → Subscription → Consumer
- Azure Service Bus: Topic + Subscription
- RabbitMQ: Topic exchange + bound queue
Each subscription or bound queue acts as an independent consumer endpoint.
Workload configuration
The benchmark used fixed-volume tests, where a producer sends a predefined number of messages while consumers process them concurrently. Each message contains a timestamp, allowing measurement of end-to-end latency from publish time until successful processing.
Message sizes tested
- 1 KB
- 10 KB
- 100 KB
Consumer concurrency
- 1 consumer
- 5 consumers
- 20 consumers
This produced the following test matrix:
| Message size | Consumer concurrency |
|---|---|
| 1 KB | 1, 5, 20 |
| 10 KB | 1, 5, 20 |
| 100 KB | 1, 5, 20 |
Each scenario was executed for both queue messaging and publish/subscribe messaging.
Metrics measured
The benchmark collected the following metrics:
- Send throughput – Messages successfully published per second.
- End-to-end throughput – Messages processed and acknowledged per second.
- Latency distribution – p50 (median), p95 (tail latency), p99, and maximum latency.
Latency is measured from publish time to successful completion, meaning it includes any time a message spends waiting in the queue.
Benchmark results
Queue throughput vs consumer concurrency
The graph below shows how queue throughput changes as the number of consumers increases. Several patterns are visible.
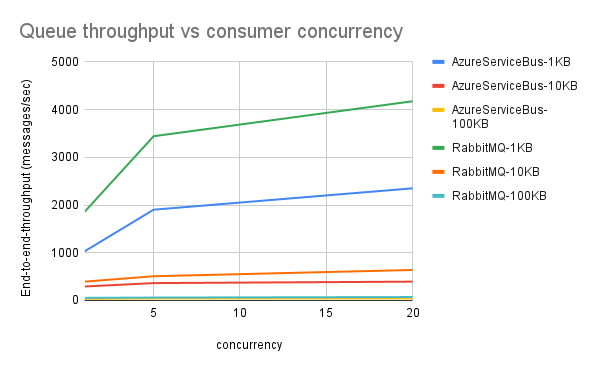
First, throughput increases as concurrency grows for both systems. Moving from one consumer to five consumers significantly improves performance because the queue backlog is processed faster. However, the increase is not linear. The largest improvement occurs between 1 and 5 consumers, while the jump from 5 to 20 consumers produces smaller gains. This indicates that other factors, such as broker capacity, network bandwidth, or client overhead, begin to dominate.
RabbitMQ consistently achieved higher throughput for small messages (1 KB) in this environment, reaching over 4000 messages per second with 20 consumers. Azure Service Bus showed lower throughput but improved steadily as concurrency increased. For larger messages, both systems show reduced throughput, which is expected due to increased network and serialization costs.
Queue throughput vs message size
The graph below highlights the impact of message size on messaging performance.
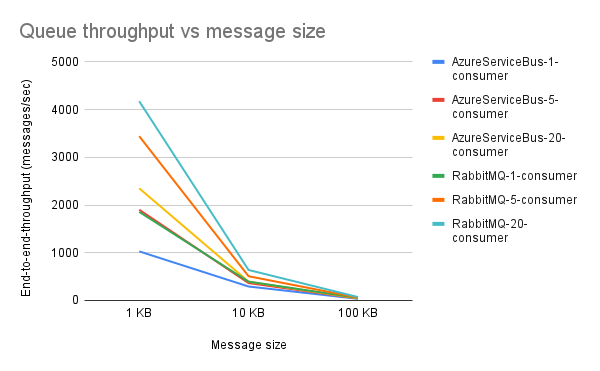
Across both systems, throughput drops significantly as message size increases:
- 1 KB messages achieve the highest throughput
- 10 KB messages reduce throughput substantially
- 100 KB messages cause throughput to drop even more
This behavior occurs because larger messages require more network bandwidth, serialization and deserialization, and memory usage inside the broker. RabbitMQ maintained higher throughput for smaller messages in this setup, but the gap between the systems narrows as message size increases.
Topic throughput vs consumer concurrency
Topic-based messaging introduces additional routing overhead.
In Azure Service Bus — Producer → Topic → Subscription → Consumer. Each message must be stored and delivered through the topic infrastructure before reaching the subscription queue.
In RabbitMQ — Producer → Topic Exchange → Queue. The exchange evaluates binding rules and routes the message accordingly.
The graph below shows patterns similar to queue messaging:
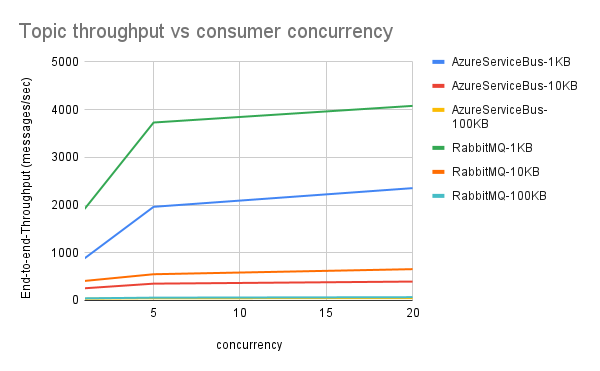
- Increasing concurrency improves throughput
- RabbitMQ maintains higher throughput for small messages
- The improvement between 5 and 20 consumers is smaller than between 1 and 5
This suggests that consumer scaling helps reduce queue backlog but does not eliminate other system bottlenecks.
Topic throughput vs message size
The message size trend is even more visible in topic messaging. Both systems experience a sharp decline in throughput as message size grows. Topic routing adds additional processing overhead compared to simple queue messaging, which amplifies the performance impact of larger messages.
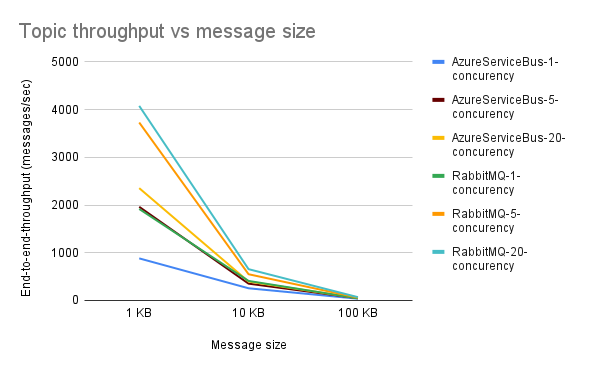
For small messages (1 KB), RabbitMQ again shows significantly higher throughput in this setup. However, once the message size reaches 100 KB, both systems converge to relatively low throughput levels because the workload becomes dominated by data transfer rather than routing.
Latency analysis
Tail latency (p95) represents the latency experienced by the slowest portion of messages. The results show that latency grows significantly with message size. This is expected because larger messages take longer to transmit and process. Another important factor affecting latency is queue backlog.
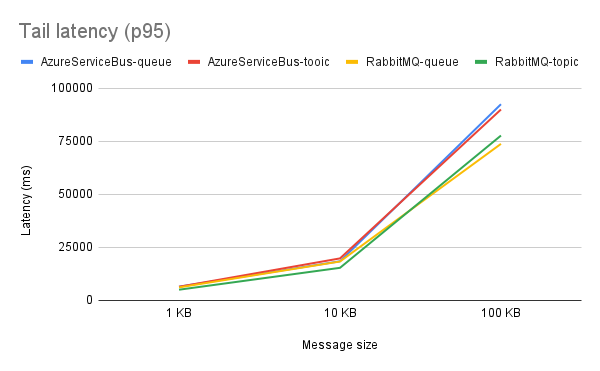
When producers publish messages faster than consumers can process them, messages accumulate in the queue. As a result, some messages experience long waiting times before being processed. This queue waiting time contributes heavily to the p95 latency values observed in the graph.
Median latency (p50) provides a clearer view of the typical processing time for most messages. For small messages, both systems show relatively low median latency.
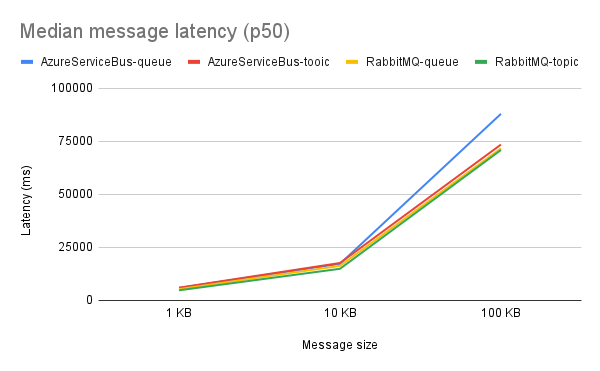
As message size increases to 100 KB, latency increases significantly for both systems due to the larger amount of data being transferred and processed. RabbitMQ shows somewhat lower median latency in this environment, particularly for large messages, although both systems exhibit similar scaling behavior as message size grows.
Observations
From the benchmark results, several patterns emerge.
Message size is the strongest factor affecting throughput. Across both systems, throughput drops rapidly as message size increases from 1 KB to 100 KB.
Increasing consumer concurrency improves throughput but with diminishing returns. Most of the performance improvement occurs between one and five consumers.
RabbitMQ achieved higher throughput in this test environment. This is especially visible for small messages where lightweight routing and push delivery allow higher message rates.
Latency increases primarily due to queue backlog and message size. Large messages and producer bursts can significantly increase end-to-end latency.
Benchmark limitations
These results reflect a specific environment and configuration.
The benchmark used:
- Azure Service Bus Premium
- RabbitMQ on CloudAMQP
- Python clients
- A single producer
Different environments may produce different results. Messaging performance depends heavily on workload patterns and infrastructure configuration.
For this reason, benchmarks like this should be interpreted as engineering observations rather than definitive performance rankings.
Final thoughts
Both RabbitMQ and Azure Service Bus solve the same fundamental problem: decoupling systems through asynchronous messaging.
In our benchmark environment, RabbitMQ delivered higher raw throughput. However, performance is only one aspect of the decision.
RabbitMQ emphasizes flexibility, powerful routing capabilities, and architectural control. It can run across different cloud providers, containers, or on-prem environments, making it a strong choice for portable or hybrid architectures. When teams want these capabilities without operating the infrastructure themselves, managed platforms such as CloudAMQP provide production-ready RabbitMQ clusters with monitoring, scaling, and operational management handled by the platform.
Azure Service Bus focuses on simplicity and fully managed infrastructure within the Azure ecosystem. It integrates tightly with Azure identity, monitoring, and platform services.