If you want the customer view first, read Live broker logs in the CloudAMQP console for LavinMQ and RabbitMQ. All hostnames, exchange names and users in this post are examples, and acme-prod stands for a customer cluster.
Why rebuild
The old pipeline leaned on a RabbitMQ feature: the broker can publish its own log lines to an internal exchange. We bound a queue to it inside every customer broker, and a shovel on that same broker forwarded the lines to a central RabbitMQ log server. The console consumed from the log server.
That design had one hard limit and two soft ones. The hard one: LavinMQ has no internal log exchange, so LavinMQ clusters could not have a log view at all. The soft ones: the pipeline put a queue and a shovel definition inside every customer’s broker, and it made the log server a RabbitMQ-to-RabbitMQ dependency for the whole fleet. More on the second point at the end.
Meanwhile, every CloudAMQP server already runs an OpenTelemetry Collector for the customer-facing log and metrics integrations. It already reads the journal. It already knows how to filter to broker lines. The natural move was to add one more exporter and take the broker out of the loop entirely.
A third motive was less about logs than about LavinMQ. Every server in the fleet that holds one AMQP connection to a single LavinMQ cluster is a production test of connection count at a scale we do not see in benchmarks, on a workload where a dropped line costs little. And since we were going to store logs in a broker anyway, we wanted to use streams and see how the feature holds up when we are the customer.
The pipeline
The publisher: one collector per server
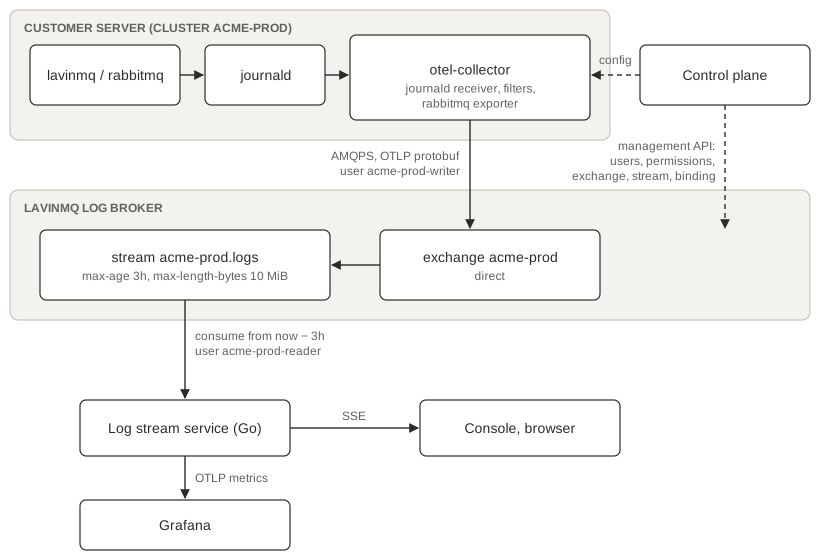
The collector’s logs pipeline for this exporter is the same one the customer integrations use. The journald receiver reads every priority, so a broker set to debug still gets through, persists its cursor to disk so a collector restart resumes where it stopped, and has retry_on_failure enabled so a downstream error pauses reading rather than dropping the batch. Four processors follow: a filter that keeps only records whose syslog identifier is the broker, a second filter that drops RabbitMQ output that did not arrive through the journal protocol, a transform that maps journald priority to OTLP severity, sets an application attribute and truncates the body at 16 KiB, and a resource processor that sets service.name to the cluster name and host.name to the server name. Those two resource attributes are what the console later shows as the cluster and server columns.
The exporter is the collector’s RabbitMQ exporter, which, despite the name, is a plain AMQP 0-9-1 publisher. It encodes each batch as OTLP protobuf through an encoding extension and publishes it to a direct exchange named after the cluster, with a fixed routing key:
"rabbitmq/broker-logs": {
  "connection": {
    "endpoint": "amqps://log-broker.example.net:5671",
    "vhost": "logs",
    "name": "acme-prod-01",
    "auth": { "plain": { "username": "acme-prod-writer", "password": "…derived per cluster…" } },
    "heartbeat": "0.5s"
  },
  "routing": { "exchange": "acme-prod" },
  "encoding_extension": "otlp_encoding/broker-logs"
}
Three things in that block are deliberate. The connection is named after the server, so on the Log Broker’s management interface every connection is identifiable at a glance. The exporter publishes persistent messages with publisher confirms and the mandatory flag, and waits for the broker’s ack before it considers a batch delivered; with the receiver’s retry behind it, a Log Broker restart means a pause, not a gap. And the heartbeat is set to a value under one second, which does something other than what it appears to do. That gets its own section below.
One exchange and one stream per cluster
On the Log Broker, each customer cluster owns two objects: a durable direct exchange named after the cluster, and a stream queue bound to it. The exchange exists so the writer permission can be anchored to a name the writer alone may publish to; the stream is the storage. Both are created by our control plane through the management API when a cluster is created, and a reconciler periodically brings the broker in line with the fleet: it creates what is missing for live clusters, re-applies users and permissions, and deletes streams and exchanges whose cluster is gone. Per-stream failures are counted and reported, and the run continues, so one broken cluster never blocks the rest.
The collector never declares anything. Its config only works once the control plane has created the exchange and the user, which means the order of operations during a rollout is fixed: provision on the broker first, then ship collector configuration. Getting that backward produces a fleet of collectors failing authentication until the reconciler runs. Nothing is lost that would otherwise have been kept, but it is noisy, and it is the kind of coupling worth writing down.
The broker side
Streams, and why they fit
A LavinMQ stream is an append-only log inside the broker. Publishing appends; consuming reads from an offset chosen by the consumer, and the broker retains messages according to a retention policy rather than deleting them on ack. That is the shape a log already has, so the mapping is direct:
- Replay for free. The console consumer asks for everything from three hours before the request. No separate history store, no draining a queue on page open.
- Many readers, no coordination. Two people opening the same cluster’s log page get two independent consumers at two independent offsets. Neither steals lines from the other, as a classic queue would.
- Bounded storage. Retention is a policy on the Log Broker, currently 3 hours or 10 MiB per stream, whichever bound is hit first. The policy is managed with the LavinMQ Terraform provider, so changing retention is a pull request, not a code change or a redeclare.
The consumer only ever asks for three hours, so the retention policy and the consumer window are set to the same number on purpose. Raising one without the other either wastes disk or shows a shorter history than the stream holds.
Credentials and permissions
Every cluster gets two users on the Log Broker, and the permissions are the actual security boundary:
acme-prod-writer   configure: ^$   write: ^acme-prod$        read: ^$
acme-prod-reader   configure: ^$   write: ^$                 read: ^acme-prod\.logs$
The writer may publish to exactly one exchange and may not declare, bind, delete or consume anything. The reader may consume from exactly one stream and may not publish or declare anything. Binding a queue requires both read permission on the exchange and write permission on the queue, so neither user can create a path from another cluster’s exchange to their own stream.
The writer password is derived, not stored: HMAC-SHA256 over the cluster name, keyed with a secret that lives only in the control plane. The control plane computes the same value when it provisions the user and when it renders the collector config, so the two cannot drift, and there is no password table to protect. The collector config on a customer server does contain that server’s writer password in clear text, and a customer with root access, or an attacker on the box, can read it. What they hold is a publish-only credential for one exchange. HMAC is one-way, so the secret cannot be recovered from the password, and no other cluster’s password can be derived from it.
The reader password is shared across all reader users. That is acceptable because it never leaves our infrastructure: only the control plane and the log stream service hold it. The stream service derives the reader username from the cluster ID in the request token, not from anything the browser sends, so even if the service has a bug, it cannot pick a stream the token was not issued for.
The management API path the control plane uses to provision all this runs on separate admin credentials and is not reachable from either the collector or the stream service, which only ever hold AMQP credentials.
The heartbeat that isn’t
The exporter’s heartbeat is configured to half a second, and the effect is not a half-second heartbeat. The exporter uses the amqp091-go client, and in that client, a configured heartbeat below one second means use the interval the server proposes in the tune handshake. The client truncates its value to whole seconds, gets zero, and the negotiation picks the server’s number. Our LavinMQ clusters propose 300 seconds, so each collector connection ends up with a 300-second heartbeat, and the client sends a heartbeat frame roughly every 150 seconds when idle.
The exporter’s default is 5 seconds. The difference across the fleet:
| Configured | Negotiated | Idle heartbeat frames per second, 15,000 connections |
|---|---|---|
| 5s (default) | 5s | about 6,000 |
| 0.5s | 300s (server’s) | about 100 |
Six thousand frames a second is not a lot of bytes, but it is six thousand wakeups a second on a broker whose actual work is a trickle of log batches. A hundred is noise.
Is a long heartbeat safe? The AMQP heartbeat exists to detect a dead peer and to keep intermediaries from dropping an idle connection. Between a collector and the Log Broker, there is no intermediary: it is a direct TLS connection from the server to the broker, and both ends run an operating system with TCP keepalive enabled. Keepalive detects a dead peer at the transport layer without any application frames. AMQP heartbeats earn their cost when there is a proxy, a load balancer or a NAT gateway in the path that will not see, or will not honor, TCP keepalive, and that is not this path. So the long interval is not a compromise; it is the right setting, and the 300-second window is still there as a backstop for a half-open connection the kernel somehow misses.
If I had wanted heartbeats off entirely, the client would need the server to propose zero, which is a broker configuration change. I did not need that.
Connection count as the real load
The throughput on the Log Broker is small; broker logs are quiet most of the time. The load that matters is connections: one long-lived TLS connection per server in the fleet, on the order of 15,000 when fully rolled out, each with a channel in confirm mode and a publisher that wakes up when the collector has a batch. That is a different shape from most benchmarks, which push messages through a few connections, and it is precisely the shape we wanted to run LavinMQ against in production. The Log Broker is a LavinMQ cluster like any customer’s, provisioned the same way, and it sits on a workload where a failure costs a log line rather than a customer’s data. It is the best kind of dogfooding.
The consumer
The log stream service is a small Go program with one endpoint. A request carries a signed token bound to a single cluster. The service validates the token, resolves the Log Broker host, vhost, and cluster name from the control plane’s database, connects as that cluster’s reader, and streams to the browser over Server-Sent Events until the browser goes away or the broker drops the connection.
The consume call is where the stream feature does its work:
if err := ch.Qos(10, 0, false); err != nil { … }

offset := time.Now().Add(-3 * time.Hour)
deliveries, err := ch.Consume(
	"acme-prod.logs",
	"",    // consumer tag, broker-assigned
	false, // autoAck
	false, false, false,
	amqp.Table{"x-stream-offset": offset},
)
Two details. Stream consumers must set a prefetch, because a stream does not remove messages on ack; the ack is a flow-control signal, telling the broker it may send the next window. Ten is plenty for a browser. And x-stream-offset accepts a timestamp, so “three hours ago” is expressed as exactly that, rather than as an offset number the service would have to look up. The broker seeks to the first message at or after that time and delivers forward from there, then keeps delivering as new messages arrive. There is no seam between replay and live.
Each delivery is an OTLP LogsData protobuf. The service walks resource, scope, and record, reads host.name from the resource attributes for the server column, maps the OTLP severity number to a name, and writes one SSE data: block per record as [timestamp] [server] [severity] message, splitting multi-line bodies across data: lines so the browser reassembles them into a single event. A malformed payload is logged and acked, and the stream continues. Every second the service sends a ping event, so idle connections are visibly alive. If the AMQP connection closes under it, the service emits an error event and ends the response, and the browser’s EventSource reconnects with the same token, which lands it back at now minus three hours.
One consumer per open page means one AMQP connection per open page. We have not put a cap on that, because the number of people watching broker logs at any one moment is small compared with the 15,000 publishers, and the service reports what it is doing: the built-in OpenTelemetry metrics export gives us active streams and lines delivered per cluster, stream lifetime by end reason (client left, write error, broker disconnect, consumer canceled), setup failures by stage (lookup, dial, channel, QoS, consume), and Go runtime metrics, all in Grafana. If the reader side ever becomes the bottleneck, the graph will say so before a customer does.
Compared with the shovel pipeline, and what scales
Let’s be fair to the old design. It worked for years, and nothing in it was wrong. What it was, was hard to maintain and difficult to grow.
| Shovel pipeline | Collector pipeline | |
|---|---|---|
| Source | RabbitMQ’s internal log exchange, inside the customer broker | The system journal on the server, outside the broker |
| Brokers supported | RabbitMQ only | LavinMQ and RabbitMQ |
| Footprint on the customer broker | An internal queue and a shovel definition | None |
| Transport | RabbitMQ shovel, broker to broker | OpenTelemetry Collector, AMQPS with publisher confirms |
| Log server | Central RabbitMQ log servers, every cluster shovelling to each | LavinMQ clusters, assigned per target |
| Storage | Classic queue, drained on page open | Stream, 3h / 10 MiB retention, replay from any offset |
| Credentials | Reused cluster credentials on the log server | Per-cluster derived writer, publish-only; shared internal reader, read-only |
The maintenance pain came from the transport. A shovel is a RabbitMQ client running inside one RabbitMQ and connecting to another, and the two ends have to agree on TLS versions and cipher suites. Upgrading the central log server meant a new Erlang and a new TLS stack on one end of thousands of shovels whose other ends ran whatever RabbitMQ version each customer was on. Some subset of shovels would decide they could no longer negotiate and quietly die, and a shovel that has died does not restart itself. Log server upgrades became something to plan around, and the fix for a dead shovel was to delete and recreate it, per cluster.
The scaling limit came from topology. There was one log server, then two, and every cluster shoveled to both. Adding capacity meant adding another server that every cluster had to be told about, which meant touching every customer broker again. There was no way to say “these clusters go there”.
The new pipeline is built around targets. A target is a Log Broker plus a matcher: a glob on the cluster name, or a glob on the region in provider::region form. A cluster’s collector publishes to every target that matches it, and the console reads from the first match. Today that is one target for the whole fleet, but the same mechanism gives us, without code changes to the collector or the stream service:
- One Log Broker per region. Logs stay in the region where they were written; the publisher’s round trip is short, and a regional outage takes down that region’s log view and nothing else.
- Sharding by name. If one Log Broker’s connection count gets uncomfortable, split the fleet across two brokers based on the name pattern. The reconciler provisions the new broker; the collectors get a new config. Done.
- Overlap during migration. Two matching targets means the collector publishes to both, so a Log Broker can be replaced by adding its successor, waiting for the retention window, and removing the old one. No cutover moment, no lost history.
The operational cost of a target change is the two-step order I mentioned: provision on the broker, then reconfigure collectors. Shrinking a pattern runs the same steps in reverse, so collectors stop publishing before their streams are deleted.
Closing
What we like most about the result is how little of it is special. A collector that already existed, one more exporter, a direct exchange and a stream per tenant, two users with anchored permissions, a consumer that says “from three hours ago” and gets exactly that. The Log Broker is a LavinMQ cluster like the ones we sell, and every server in the fleet is now a client of it. If streams are as easy to use as we think they are, this is where I find out.
👋
This blog is written by developers at CloudAMQP to showcase CloudAMQP improvements. We have over a decade of experience helping companies expand their messaging knowledge and usage. Support is included in all CloudAMQP plans, available around the clock.
Discover CloudAMQP, Free RabbitMQ Training, Free RabbitMQ Ebook, Free LavinMQ Ebook, LavinMQ Website
 Magnus Landerblom