
We built LavinMQ, and we run it across the CloudAMQP fleet of thousands of message brokers, so this guide is about which numbers matter, where to get them, and what to do with them. This guide is written for LavinMQ 2.11, and some of the metrics and features it describes are not available in earlier versions.
Metrics tell you what is happening: how much disk is left, how deep a queue is, how far behind a follower is. Logs tell you why: a client that stopped sending heartbeats, a consumer that held a message past its timeout, a follower the leader gave up on. Health checks only answer whether this node can take traffic right now, and they answer fast enough for a load balancer to act on it.
Where LavinMQ metrics come from
LavinMQ has two built-in ways to get metrics out of the broker, and they suit different jobs.
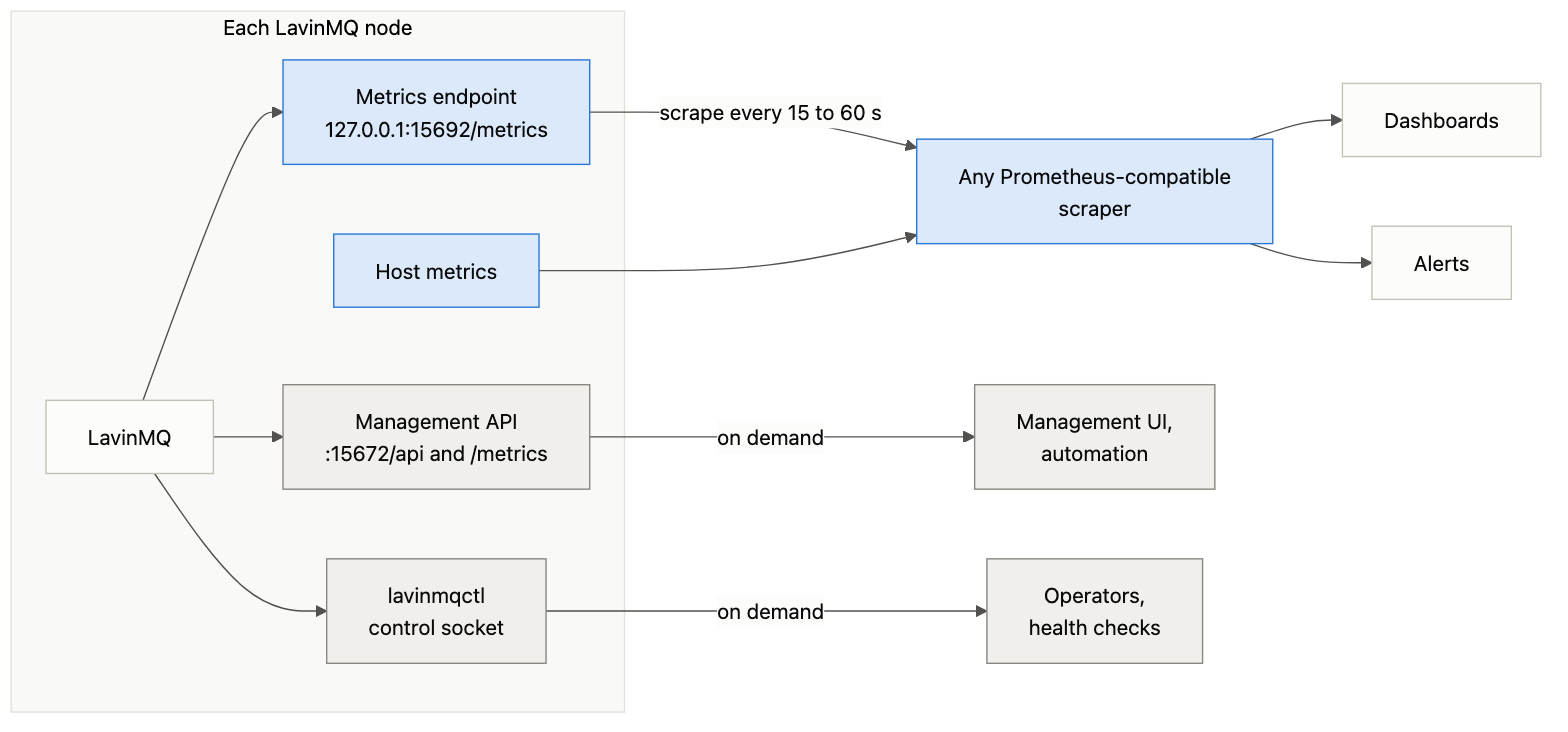
The paths metrics take out of a LavinMQ node: the metrics endpoint and host metrics feed a scraper, dashboards and alerts, while the management API and lavinmqctl serve humans and automation.
The Prometheus endpoints
LavinMQ exposes Prometheus metrics on two ports. One is a metrics server on 127.0.0.1:15692 without authentication, which only answers on the local host unless you change its bind address in the configuration. The other is the management port under /metrics, behind the management credentials and limited to the vhosts that the user can see.
Every metric is prefixed lavinmq_, and there are two endpoints:
/metricsreturns aggregated metrics. Queue, connection, channel, and exchange metrics are summed per node, so the response stays the same size whether you have ten queues or ten thousand. This is the endpoint to scrape continuously./metrics/detailedlets you ask for specific metric families and filter them by vhost, for example?family=queue_coarse_metrics&vhost=production. Without afamilyparameter the response is empty. The families arequeue_coarse_metrics,queue_consumer_count,connection_coarse_metrics,channel_metrics,connection_churn_metrics,exchange_metricsandvhost_message_stats. This is how you get per-queue depth for the queues you care about without paying for the whole topology.
Scrape every 15 to 60 seconds. At CloudAMQP we push metrics from our own collectors once a minute, which is fast enough to catch anything a human can react to. The gauges behind the endpoint are refreshed every stats_interval, 5 seconds by default, so scraping faster only repeats values. When you build rate panels or alerts, use a range of at least four scrape intervals so a single missed scrape does not produce a gap. Every scrape also writes telemetry_scrape_duration_seconds; if it climbs, you are asking for too many detailed families on a broker with too many objects.
We publish a LavinMQ dashboard for Grafana, built on this endpoint: broker resources, queue depth, connection and channel churn, garbage collector memory and follower lag on one page, shown below. Import it and point it at whatever scrapes your nodes.
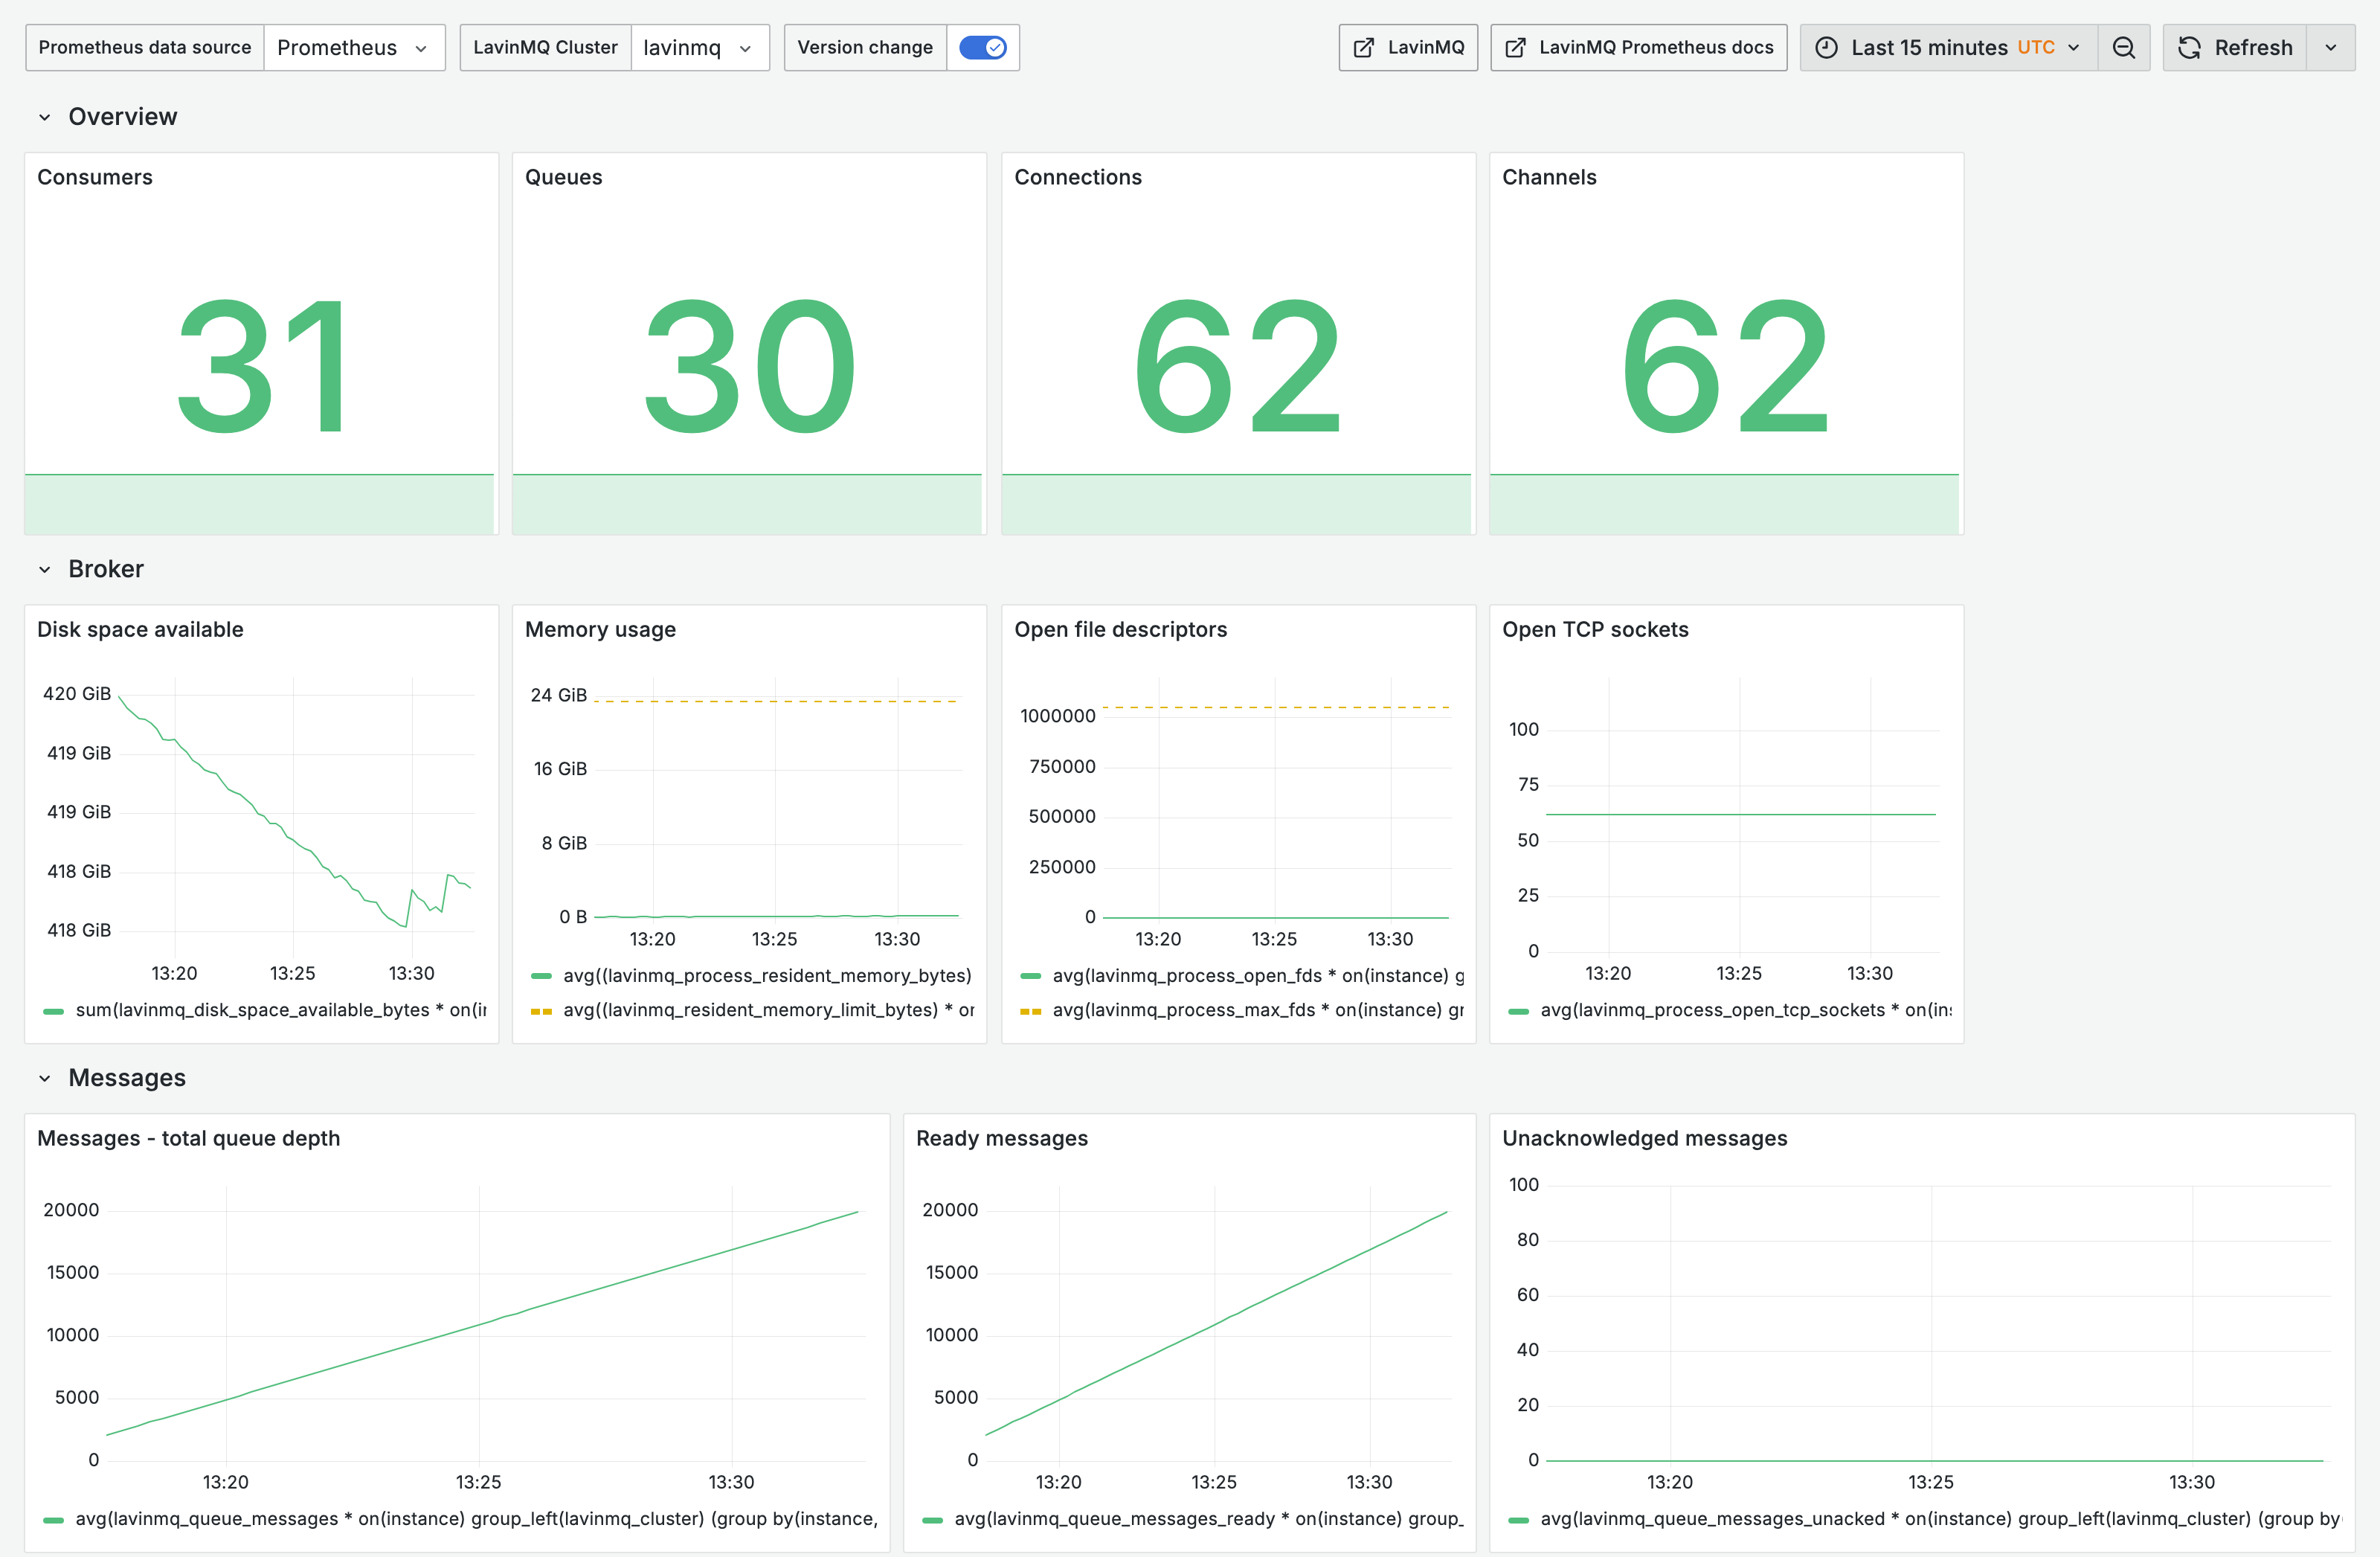
The LavinMQ dashboard we publish for Grafana, here on a single LavinMQ test node under synthetic load. The top rows show counts, broker resources and queue depth; a deliberately slow consumer is letting one queue grow.
The management HTTP API
The API on port 15672 exposes /api/overview, /api/nodes, /api/queues and /api/connections.
The API reads the broker’s own in-memory counters at request time, so /api/overview costs almost nothing, and the cost of /api/queues grows with the number of queues, not with how many messages they hold. With tens of thousands of queues, trim it with columns=name,vhost,messages_ready and page_size, and filter by queue state with state=, for example state=paused,closed. Each rate in message_stats carries a log of the last 120 samples, ten minutes at the default interval, which is what the management UI graphs. For any history longer than that, scrape the Prometheus endpoint into your own time series database.
When to use which: Prometheus endpoints vs. the management API
| Need | Use |
|---|---|
| Long-term storage, dashboards and alerting | /metrics on port 15692 |
| Per-object alerts, on queues, connections or channels | /metrics/detailed |
| Inspecting a queue, connection or policy right now | Management UI or API |
| Is this node up, and is it the leader? | systemctl is-active, lavinmqctl status, see health checks below |
Monitor host CPU, memory, and disk for LavinMQ
Host metrics matter a great deal for LavinMQ, because the broker hands its most important job, caching messages, to the kernel. Collect them from every node, with an agent or whatever your platform already provides. The ones that matter are CPU split by component, available memory rather than free memory, and free space and IO latency on the disk that holds the data directory. On CloudAMQP, we run the OpenTelemetry Collector on every server for this. A healthy node with gigabytes of queued messages shows almost no free memory and a large page cache; that is the design working.
Split CPU into its components, because each one points at a different problem:
| CPU time | Likely cause | What to do |
|---|---|---|
| High user | The broker is near capacity | Give the node more CPU, spread the load over more clusters, or reduce the message rate by batching in the application |
| High system | Connection churn or many small frames | Fix clients to reuse connections, or put a proxy in front |
| High IO wait | Publisher confirms syncing to a slow disk, or a backlog read back from disk | Faster disk, batch confirms, shorter queues |
| High steal | A noisy neighbour on shared hardware | Move to dedicated hardware |
IO wait deserves a line of its own. With sync = true, the default, a publish is only confirmed once the data is on disk, so confirm latency is really disk latency, and the disk is often the first bottleneck you hit.
LavinMQ metrics to watch
Every metric below comes from /metrics unless marked detailed, in which case it needs a family parameter on /metrics/detailed.
Disk headroom
Start with what is not there. LavinMQ has no memory watermark, no memory alarm, and no memory-based publisher blocking, because memory is not where a LavinMQ node gets into trouble. Every message is written to disk as it arrives and served from the page cache, so a deep queue costs disk rather than heap, and the broker’s own allocations stay small compared with the data it holds. LavinMQ ships with a metric that tells how much memory the process can use, lavinmq_resident_memory_limit_bytes, but nothing in the broker acts on it.
What the broker does enforce is disk, the resource a growing queue consumes. Every 5 seconds it reads the free space on the data directory and publishes it as lavinmq_disk_space_available_bytes. When free space falls below three times segment_size or below free_disk_min, whichever is higher, the broker stops flow. Flow is its term for accepting publishes. While it is stopped, every basic.publish fails with a channel-level precondition_failed reading Server low on disk space, and queue declares are refused. Consumers keep working, so queues drain, and flow resumes once free space recovers.
Because the broker closes the publishing channel with an error rather than silently holding the connection, your publishers need to handle a closed channel during a disk incident.
The defaults are not meant for production. free_disk_min and free_disk_warn both default to 0, which leaves only the built-in floor. The broker always stops flow with less than three segments of free space, 24 MiB at the default segment_size, and warns with less than six, 48 MiB. Set both to gigabytes in the configuration file, lavinmq.ini, and alert long before either, for example:
[main]
free_disk_min = 5368709120
free_disk_warn = 10737418240
On CloudAMQP we set them to 5 and 10 percent of the data disk.
You can see that flow has stopped when lavinmq_disk_space_available_bytes drops below your threshold, and in the log lines listed under Logs below.
To predict disk, know how LavinMQ uses it. Each queue has its own message store of pre-allocated 8 MiB segment files, each with an ack file, and a segment is deleted when every message in it is acknowledged. Disk use follows ready plus unacked messages, since there is no compaction step that can fall behind. Three things still make disk grow while queue depth stays flat:
- One old unacknowledged message pins its 8 MiB segment, so a stuck consumer costs at most one segment per message it holds.
- A message routed to many queues is stored once per queue. A 1 MB message routed to 100 queues uses 100 MB.
- Streams only delete whole segments on retention. A stream without
max-age,max-lengthormax-length-bytesgrows until the disk is full.
Memory, and what it means here
lavinmq_process_resident_memory_bytes is the broker’s RSS. Because segment files are memory-mapped, their resident pages count toward it, so RSS rises as queues fill and the kernel can reclaim much of it under pressure. For leaks, look at the heap instead. lavinmq_gc_heap_size_bytes and the rest of the lavinmq_gc_* metrics show what the process itself has allocated. A heap that grows for hours while connections and queues stay flat is a leak worth reporting. The alert that matters is available memory on the host. The heap, the connections, and the page cache all share the same RAM. When RAM runs out, the kernel first evicts the message cache, then the operating system starts killing processes, including the broker.
lavinmq_mfile_count is the number of memory-mapped files, roughly one per open segment and ack file, with a hard ceiling in vm.max_map_count. LavinMQ warns at startup below 100,000 and suggests sysctl -w vm.max_map_count=1000000. Recent Ubuntu releases already default to 1,048,576, which is why CloudAMQP servers have it without any extra setup. Also watch file descriptors by comparing lavinmq_process_open_fds with lavinmq_process_max_fds. Every connection holds a file descriptor, so a slow connection leak shows up here long before it reaches the limit. Alert at 80 percent.
Queue depth, and its direction
lavinmq_queue_messages_ready, lavinmq_queue_messages_unacked and their sum lavinmq_queue_messages are the totals. Per queue, family=queue_coarse_metrics gives lavinmq_detailed_queue_messages_ready, _unacked and _messages with queue and vhost labels, plus lavinmq_detailed_queue_messages_delivered_total and lavinmq_detailed_queue_messages_acked_total. MQTT sessions are currently backed by queues and are therefore counted in all of these.
Keep queues short, a long queue costs latency. A new message waits behind everything already queued, and older messages in a deep queue often leave the page cache, so delivering them means reading from disk. It also costs disk space and time at restart, when the broker reads every ack file to rebuild its view of each segment.
The absolute number matters less than its trend. A queue holding 100,000 messages that drains every night is a design choice. A queue at 5,000 that has climbed steadily for an hour is an incident starting quietly. Set queue alarms from normal peak behavior, not theoretical limits, alert on sustained growth, and still bound every queue with max-length or message-ttl.
Streams are the exception. They keep messages until retention removes a whole segment, so their depth is a retention setting, not a warning sign. There is no server-side consumer offset lag metric. Each delivery carries an x-stream-offset header, so have stream consumers export their own offset.
Read ready and unacked together. Ready rising with unacked flat means consumers are not being offered work fast enough, or there are too few of them. When the unacked count keeps rising, consumers receive messages but don’t acknowledge them. Common causes are consumers that process too slowly or crash before they ack. Unbounded prefetch is the classic version of this, where one consumer takes the whole queue into memory and dies. Use family=channel_metrics for lavinmq_detailed_channel_prefetch and lavinmq_detailed_messages_unacked per channel to see which client is holding messages.
Two defaults to know about. First, consumer_timeout defaults to off, so an unacked message can sit for weeks and pin its segment. Set it in milliseconds in the configuration file, or per queue with the consumer-timeout policy or x-consumer-timeout argument; a channel that holds a message past it is closed with precondition_failed and the text consumer timeout.
Second, queues have a state: running, paused, flow, closed or deleted. A queue goes closed on an internal error and stays closed until someone restarts it, and clients cannot tell that it is closed. Publishes to it are dropped and still confirmed, unless the publisher sets mandatory, and a consumer that subscribes gets consume-ok and then waits forever. No metric exposes queue state, so check GET /api/queues?state=closed on a schedule and alert when the list is not empty, and index the Queue closed due to error line in your logs. That line says why the queue closed, so read it before you restart the queue with lavinmqctl restart_queue <queue> or PUT /api/queues/:vhost/:name/restart. On CloudAMQP, we check every cluster for closed queues.
Consumers
lavinmq_consumers is the total, and family=queue_consumer_count gives lavinmq_detailed_queue_consumers per queue. For every queue that feeds a core workflow, alert when it drops to zero. Otherwise, a crashed worker sits unnoticed until the queue alarm fires hours later. family=connection_churn_metrics adds lavinmq_detailed_consumers_added_total and lavinmq_detailed_consumers_removed_total, which catch a consumer resubscribing in a loop. For poison messages, delivery-limit exists as a policy key or x-delivery-limit queue argument. A message redelivered past it is dead-lettered if the queue has a dead-letter exchange and dropped otherwise. lavinmq_global_messages_dead_lettered_delivery_limit_total counts both cases.
Connections, channels and churn
lavinmq_connections and lavinmq_channels are the totals. The counters that matter are lavinmq_connections_opened_total, lavinmq_connections_closed_total, lavinmq_channels_opened_total and lavinmq_channels_closed_total, plus lavinmq_queues_declared_total and lavinmq_queues_deleted_total, where churn from temporary reply queues shows up first.
LavinMQ is built for long-lived connections. Opening one connection costs a TCP handshake, a protocol handshake, and authentication before the first message, plus a file descriptor on the broker for as long as it lives. The pattern we recommend is one connection per process, one channel per thread, and separate connections for publishing and consuming. Applications that open a connection per message show up as connection churn and high system CPU. Three LavinMQ settings help you enforce the pattern. The server proposes a 300-second heartbeat and closes a connection that sends nothing for that interval plus five seconds. channel_max defaults to 2048 per connection, so a channel leak hits a wall. Per-vhost max-connections and max-queues limits log Max connections (100) reached for vhost / when they are hit. If the client is not yours to change, put a connection-pooling proxy such as AMQProxy in front of the broker.
Every connection open and close is logged at the default info level as Connection established for user=app and Connection disconnected for user=app duration=.... You do not need to raise a log level to see churn, and a stream of sub-second durations from one address is a connection-per-message client.
Message flow
The aggregated counters are lavinmq_global_messages_delivered_total, _redelivered_total, _acknowledged_total, _confirmed_total and _unroutable_returned_total. There is no aggregated publish counter. The publish rate is in /metrics/detailed as lavinmq_detailed_vhost_messages_published_total with family=vhost_message_stats, one series per vhost, so scrape that family.
LavinMQ counts unroutable messages that were returned, not ones that were dropped. A message published without mandatory to an exchange with no matching binding vanishes without a counter, so publish with mandatory if you need to know, then alert on any non-zero rate of unroutable_returned_total.
LavinMQ also counts messages that leave a queue without being acknowledged: lavinmq_global_messages_dead_lettered_delivery_limit_total, _expired_total, _maxlen_total and _rejected_total, one per reason. The dead_letter_strategy label tells you where they went: at_most_once means the message was sent to a dead-letter exchange, and disabled means the queue had none and the message was dropped. A rising disabled series on a queue where you did not expect losses is messages gone for good.
Redelivery is the hidden cost we see most often. A consumer that rejects instantly on failure creates a tight redelivery loop that burns CPU and network. Use a delivery limit and dead-letter the message, or back off before rejecting. On a single node, a publish is confirmed once it is synced to disk, and in a cluster once every in-sync follower has it. A gap between publish and confirm rates points to disk latency or replication.
Clustering: leader, followers, and the in-sync replica set
LavinMQ clustering has one leader that handles every client and every write, followers that replicate its data directory and proxy clients to it, and etcd that runs the election and records which followers are in sync.
You should monitor the replica set. On the leader, lavinmq_total_connected_followers is how many followers are streaming and lavinmq_follower_lag_in_bytes{id} is the bytes sent to each and not yet acknowledged. lavinmq_follower_bytes_sent_total and lavinmq_follower_bytes_acked_total on the leader and lavinmq_cluster_received_bytes_total on the follower graph replication throughput with rate().
Only the leader reports broker metrics. On a follower, the management port, 15672, is forwarded to the leader, so its /metrics returns the leader’s numbers on every node. The metrics server on port 15692 answers locally, and on a follower it only reports the garbage collector metrics and lavinmq_cluster_received_bytes_total. Scrape /metrics on the metrics server, port 15692, on every node and label by role, so you always have the full set from whichever node is leader. Watch follower disk and memory through host metrics, because a follower holds a full copy of the data directory but does not report its own disk space.
Lag is normally zero or a few kilobytes. A follower that stops acknowledging for 3 seconds is disconnected with No ack for 00:00:03, disconnecting follower id=... and leaves the in-sync replica set, which the leader records in etcd under lavinmq/isr and logs as In-sync replicas: [1, 2]. Publish confirms wait for every in-sync follower, so eviction is what lets the leader keep confirming; a follower that keeps leaving and rejoining has a network or disk problem. Only an in-sync replica can win the next election.
So what matters is membership, not lag. An out-of-sync follower does not slow anything down, but it cannot take over if the leader fails, so a shrinking replica set means less redundancy rather than an outage. It is also normal for a few minutes during a restart or upgrade, while a follower catches up. The in-sync replica set is stored in etcd, not in the metrics. etcdctl get lavinmq/isr lists the node IDs that are in sync, and etcdctl member list lists the nodes in the cluster. Put lavinmq_total_connected_followers on the dashboard, keeping in mind that a follower counts as connected before it has caught up, and use lavinmqctl cluster_status to see the connected followers and their lag. On CloudAMQP, our monitor compares the two etcd lists. A netsplit shows up the same way. etcd decides which node leads, so a node cut off from the majority drops out of the replica set, and the same check catches it.
Reading LavinMQ logs: where the “why” lives
LavinMQ logs to stdout, or to a file if you set log_file. Under systemd it detects the journald stream and switches to journald’s priority-prefixed format, so journalctl -u lavinmq filters by severity, and a shipper reading the journal gets unit, priority, and timestamp as fields. There is no JSON formatter. On our fleet, every node runs under systemd, and we ship the journal off the host. log_level in the configuration file defaults to info, the API serves recent lines at GET /api/logs and a live stream at GET /api/livelog, and log_exchange = true publishes log entries to a topic exchange named amq.lavinmq.log with the severity as the routing key.
Ship the logs from every node, not just one. Label them the way you label metrics, with cluster and node at least, so that a spike on a graph takes you straight to the log lines from that node at that minute.
Lines worth alerting on, or at least indexing:
Low disk space: 23.9MB, stopping flowandNot low on disk space, starting flowbracket every period your publishers were refused. Both are info level.Queue closed due to error, at error level with a stack trace. The queue needs a restart. Page on this.Heartbeat timeout (300), last seen frame ... s ago, sent frame ... s ago. A burst across many connections is a network or client-side problem.Authentication failure for user "x"andAccess denied for user "x" to vhost "y". Usually a rotated credential.Precondition failed channel=1 reason="consumer timeout", and the same line withServer low on disk space. Every channel the broker closed for a reason you configured.In-sync replicas: [...],No ack for 00:00:03, disconnecting follower id=...,Lease expired, lost leadership,No leader available. The cluster is reshaping itself.- At startup,
The file descriptor limit is very low, consider raising it.andThe max mmap count limit is very low, consider raising it.; afterSIGHUP,Invalid configuration, keeping the running configuration.
LavinMQ health checks: is this node fit for traffic?
Health checks are not monitoring. They answer one binary question, usually for a load balancer, an orchestrator, or an on-call rotation, and they should be cheap enough to run every few seconds. The monitor we run across the CloudAMQP fleet asks every LavinMQ server a short list of questions:
- Is the systemd unit active?
systemctl is-active lavinmqmust sayactive. - Is the replica set complete? Compare the etcd member list with
etcdctl get lavinmq/isr.
Notice what is not on that list. No disk or queue thresholds, and no replication lag. Those belong in metrics and alarms, where you can see history and trends. Closed queues are not on it either: a node with a closed queue still takes traffic, so they belong with the queue alerts above. Health checks are for liveness.
For scripts, lavinmqctl status reads /api/overview over the local control socket with no credentials and exits with 0 on a leader, 2 on a follower, which answers 503, and 1 on any other error. Over HTTP, GET /api/aliveness-test/:vhost publishes a message through amq.direct, reads it back and answers {"status":"ok"} or {"status":"failed"} in the body, so check the body, not the status code. For load balancers and Kubernetes, a TCP check on 5672 is the right readiness probe: followers accept the connection and proxy it to the leader, so any node that answers can take traffic.
When something is wrong with your LavinMQ cluster
Metrics and logs are useless without a habit for using them. When a LavinMQ cluster on our fleet misbehaves, the on-call engineer works through the same short list every time:
- What changed? Deploys, plan changes, upgrades. Most incidents have a cause in the last 24 hours.
- Graphs: disk free first, then RSS against GC heap, file descriptors,
mfile_count, CPU split and follower count. - Does
lavinmqctl statusanswer? A broker that cannot answer its own API is in trouble. - Logs with
journalctl -u lavinmq, on every node. - If the process is alive but wrong,
kill -USR1prints GC statistics and every fiber with its name to the log, andkill -USR2forces a garbage collection to test whether heap growth was garbage.
Once the graphs have told you which resource is in trouble, the usual suspects are few:
| Symptom | Usual causes |
|---|---|
| Disk | Streams without retention. Old unacked messages pinning segments. Large messages fanned out to many queues. A leftover backups/ directory from a storage schema migration |
| Memory | Heap growth is a leak; growth in mapped pages is the page cache doing its job. Separate the two before you blame the broker |
| CPU | Connection churn. Confirm-heavy publishing on a slow disk |
Alerts worth having
Dashboards are for understanding. Alerts are for finding out. Every alert should carry a time threshold, and the CloudAMQP alarm engine never reports a condition that resolves before its threshold passes. Start with these, written in PromQL against the metrics endpoint, and tune the thresholds to your workload:
| Alert | Expression | Why |
|---|---|---|
| Disk running low | lavinmq_ for 10m |
Above free_ in the example above, so you hear about it before the broker warns or stops publishing |
| Disk will fill | predict_ for 30m |
A queue, stream or fan-out grows faster than it drains |
| Heap growing | deriv( for 6h |
A leak in connections, channels or consumers; RSS alone would mislead |
| Host memory low | Available memory below 20 percent of total for 10m, from your host metrics, for example node_ |
The page cache goes first and every delivery becomes a disk read; then the operating system starts killing processes |
| File descriptors | lavinmq_ |
Connection leak |
| Memory maps | lavinmq_ (your vm.max_) |
Too many open segments for the kernel limit |
| Queue growing | delta( for 30m |
Consumers not keeping up |
| Unacked growing | delta( for 30m |
Consumers holding messages, and no default timeout will rescue you |
| Queue without consumers | lavinmq_ for 5m |
A worker died (needs the queue_ and queue_ families) |
| Closed queue | GET / returns a non-empty list, polled every few minutes |
Publishes are dropped and consumers idle silently; nothing in the metrics shows it |
| Unroutable messages | rate( |
Messages with nowhere to go, from publishers that set mandatory |
| Redelivery ratio | rate( for 15m |
A consumer rejecting in a loop |
| Retries exhausted | rate( |
Messages that hit their delivery limit and were dead-lettered or dropped |
| Connection churn | rate( well above your baseline |
Reconnect loop or connection-per-message |
Page on the disk rows, host memory, and closed queues, since they mean publishing is about to stop, the broker is about to be killed, or messages are being dropped. The other queue alerts depend on the queue: page for one that feeds a core workflow, and use a non-paging notification for the rest. Treat the remaining rows as tuning alerts at first and keep them non-paging until you know what normal looks like for your workload, then promote the ones that turn out to matter. A second tier helps here, with the same metric at a lower threshold as a notification and a higher one to the pager.
Checklist
Collect

/metrics scraped on every node with a role label, and /metrics/detailed with explicit family and vhost parameters for the queues that need per-queue alerts
Host metrics next to the broker metrics: available memory, and IO latency on the data directory's disk
The journal shipped from every node, with the disk flow lines and Queue closed due to error indexed
Alert
Disk alerts on lavinmq_disk_space_available_bytes, well above free_disk_min and free_disk_warn
Heap growth, available host memory, lavinmq_mfile_count and file descriptors alerted, with no memory watermark rules
Queue depth trend, unacked trend and zero consumers alerted, plus closed queues via GET /api/queues?state=closed
Unroutable returns alerted, with mandatory set on publishers so they are counted
Protect
free_disk_min and free_disk_warn set to gigabytes, and vm.max_map_count raised
consumer_timeout set, delivery-limit on queues with retries, every queue bounded with max-length or message-ttl
A troubleshooting order the team follows: what changed, then disk, then version, then logs
Summary
LavinMQ gives you three signals from one binary with nothing to enable: metrics, logs, and health checks. Messages live on disk and in the page cache, so disk headroom is the number that matters, free_disk_min is the threshold that stops publishing, and a long queue is a latency problem rather than a broker emergency. Closed queues only show up in the management API, consumer timeouts are off until you turn them on, and the cluster is a leader with an in-sync replica set in etcd. Watch disk free and its trend, heap, host memory and mapped files, queue depth and direction, closed queues, connection churn, returned messages and replica set membership, and set the disk thresholds before the first incident sets them for you.
Want disk alarms, queue alarms, log shipping, and the replica set check set up for you? Every CloudAMQP LavinMQ instance ships with them. Create a free instance and open the Metrics tab.
About the author
Erica has spent years on the 84codes observability team and has also worked in customer support. She’s seen most of what can go wrong with a message broker, and how to spot it early.
 Erica Weistrand