
At CloudAMQP we have run RabbitMQ for well over a decade, across thousands of production clusters, and most of the outages we have been called into had the same shape: a number that had been moving in the wrong direction for hours before anyone looked. This guide is about which numbers those are, where to get them, and what to do with them. The short version: scrape the Prometheus plugin on every node, collect host metrics next to it, ship JSON logs from every node, and alert on resource headroom, queue growth, missing consumers, and connection churn.
Metrics tell you what is happening: how deep a queue is, how many consumers it has, how often connections come and go. Logs tell you why: a client that stopped sending heartbeats, a consumer that never acknowledged, a node that lost its peers. Health checks answer a narrower question: whether this node can take traffic right now, and they do it fast enough for a load balancer to act on.
Where RabbitMQ metrics come from
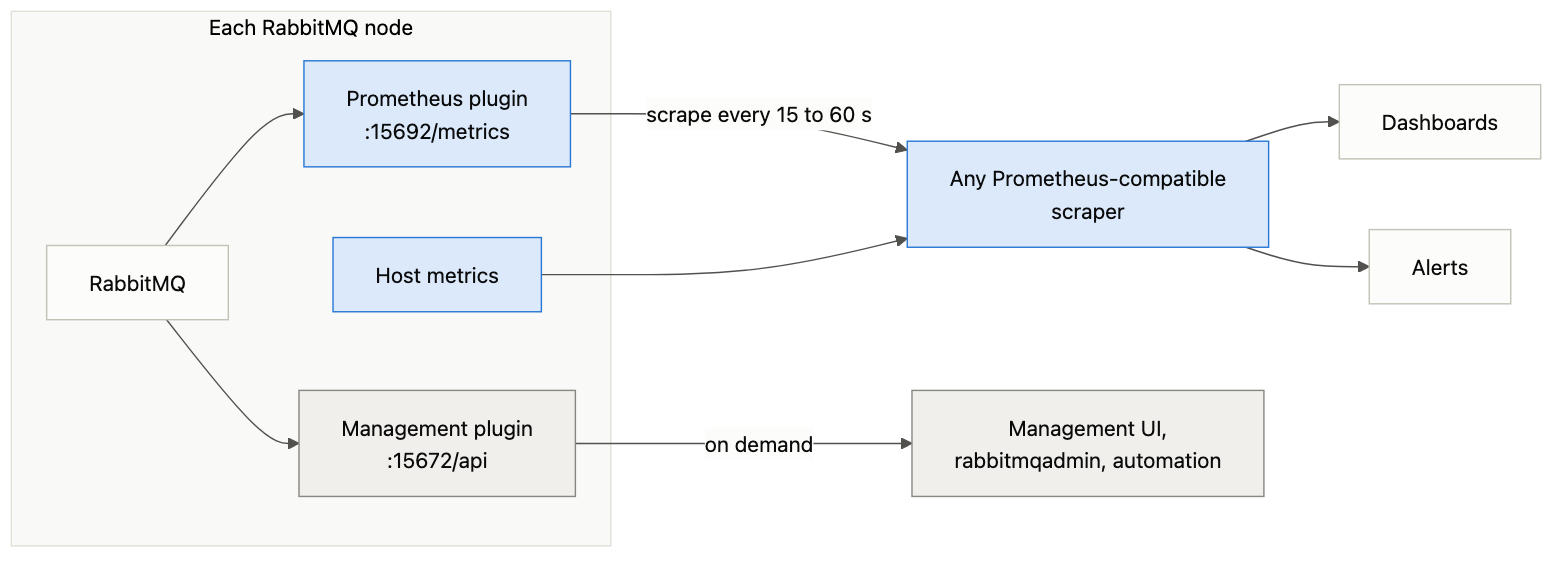
RabbitMQ has two built-in ways to get metrics out of the broker, and they suit different jobs.
The Prometheus plugin
The rabbitmq_prometheus plugin ships with RabbitMQ since 3.8 and is the right source for continuous collection. The official Docker image and the Kubernetes Cluster Operator ship with it enabled, and most managed services do, too. On Debian, RPM, and generic binary installs, you enable it yourself on every node:
rabbitmq-plugins enable rabbitmq_prometheus
Each node then serves metrics on port 15692. Scrape every node in the cluster, not just one. Node-level metrics such as memory, disk, and file descriptors only exist on the node that owns them, and each queue reports its metrics from the node it runs on, which for a quorum queue is the leader.
The plugin exposes three endpoints, and picking the right one matters at scale:
/metricsreturns aggregated metrics by default. Queue, connection, channel and exchange metrics are summed per node, so the response stays the same size whether you have ten queues or ten thousand. This is the endpoint to scrape continuously./metrics/per-objectreturns one time series per queue, channel, and connection. It gives you per-queue alerting, but the response grows with your topology and is rendered on the same CPU that routes your messages. The RabbitMQ docs put/metrics/detailedat up to 60 times cheaper for the same handful of metrics./metrics/detailedlets you ask for specific metric families and filter them by vhost, for example?family=queue_coarse_metrics&vhost=production. From RabbitMQ 4.3 you can also filter by queue name with a regular expression, such as&queue=^orders-. This is how you get per-queue depth for the queues you care about without paying for the whole topology.
Scrape every 15 to 60 seconds. At CloudAMQP we push metrics from our own collectors once a minute, which is fast enough to catch anything a human can react to. When you build rate panels or alerts, use at least four scrape intervals so a single missed scrape doesn’t create a gap.
The plugin also ships the official Grafana dashboards. RabbitMQ-Overview is the one to import first: cluster health, message rates, and node resources on one page, shown below. RabbitMQ-Quorum-Queues-Raft adds Raft log size and commit latency for quorum queues, and Erlang-Distribution shows traffic between nodes, where a saturated inter-node link shows up first.
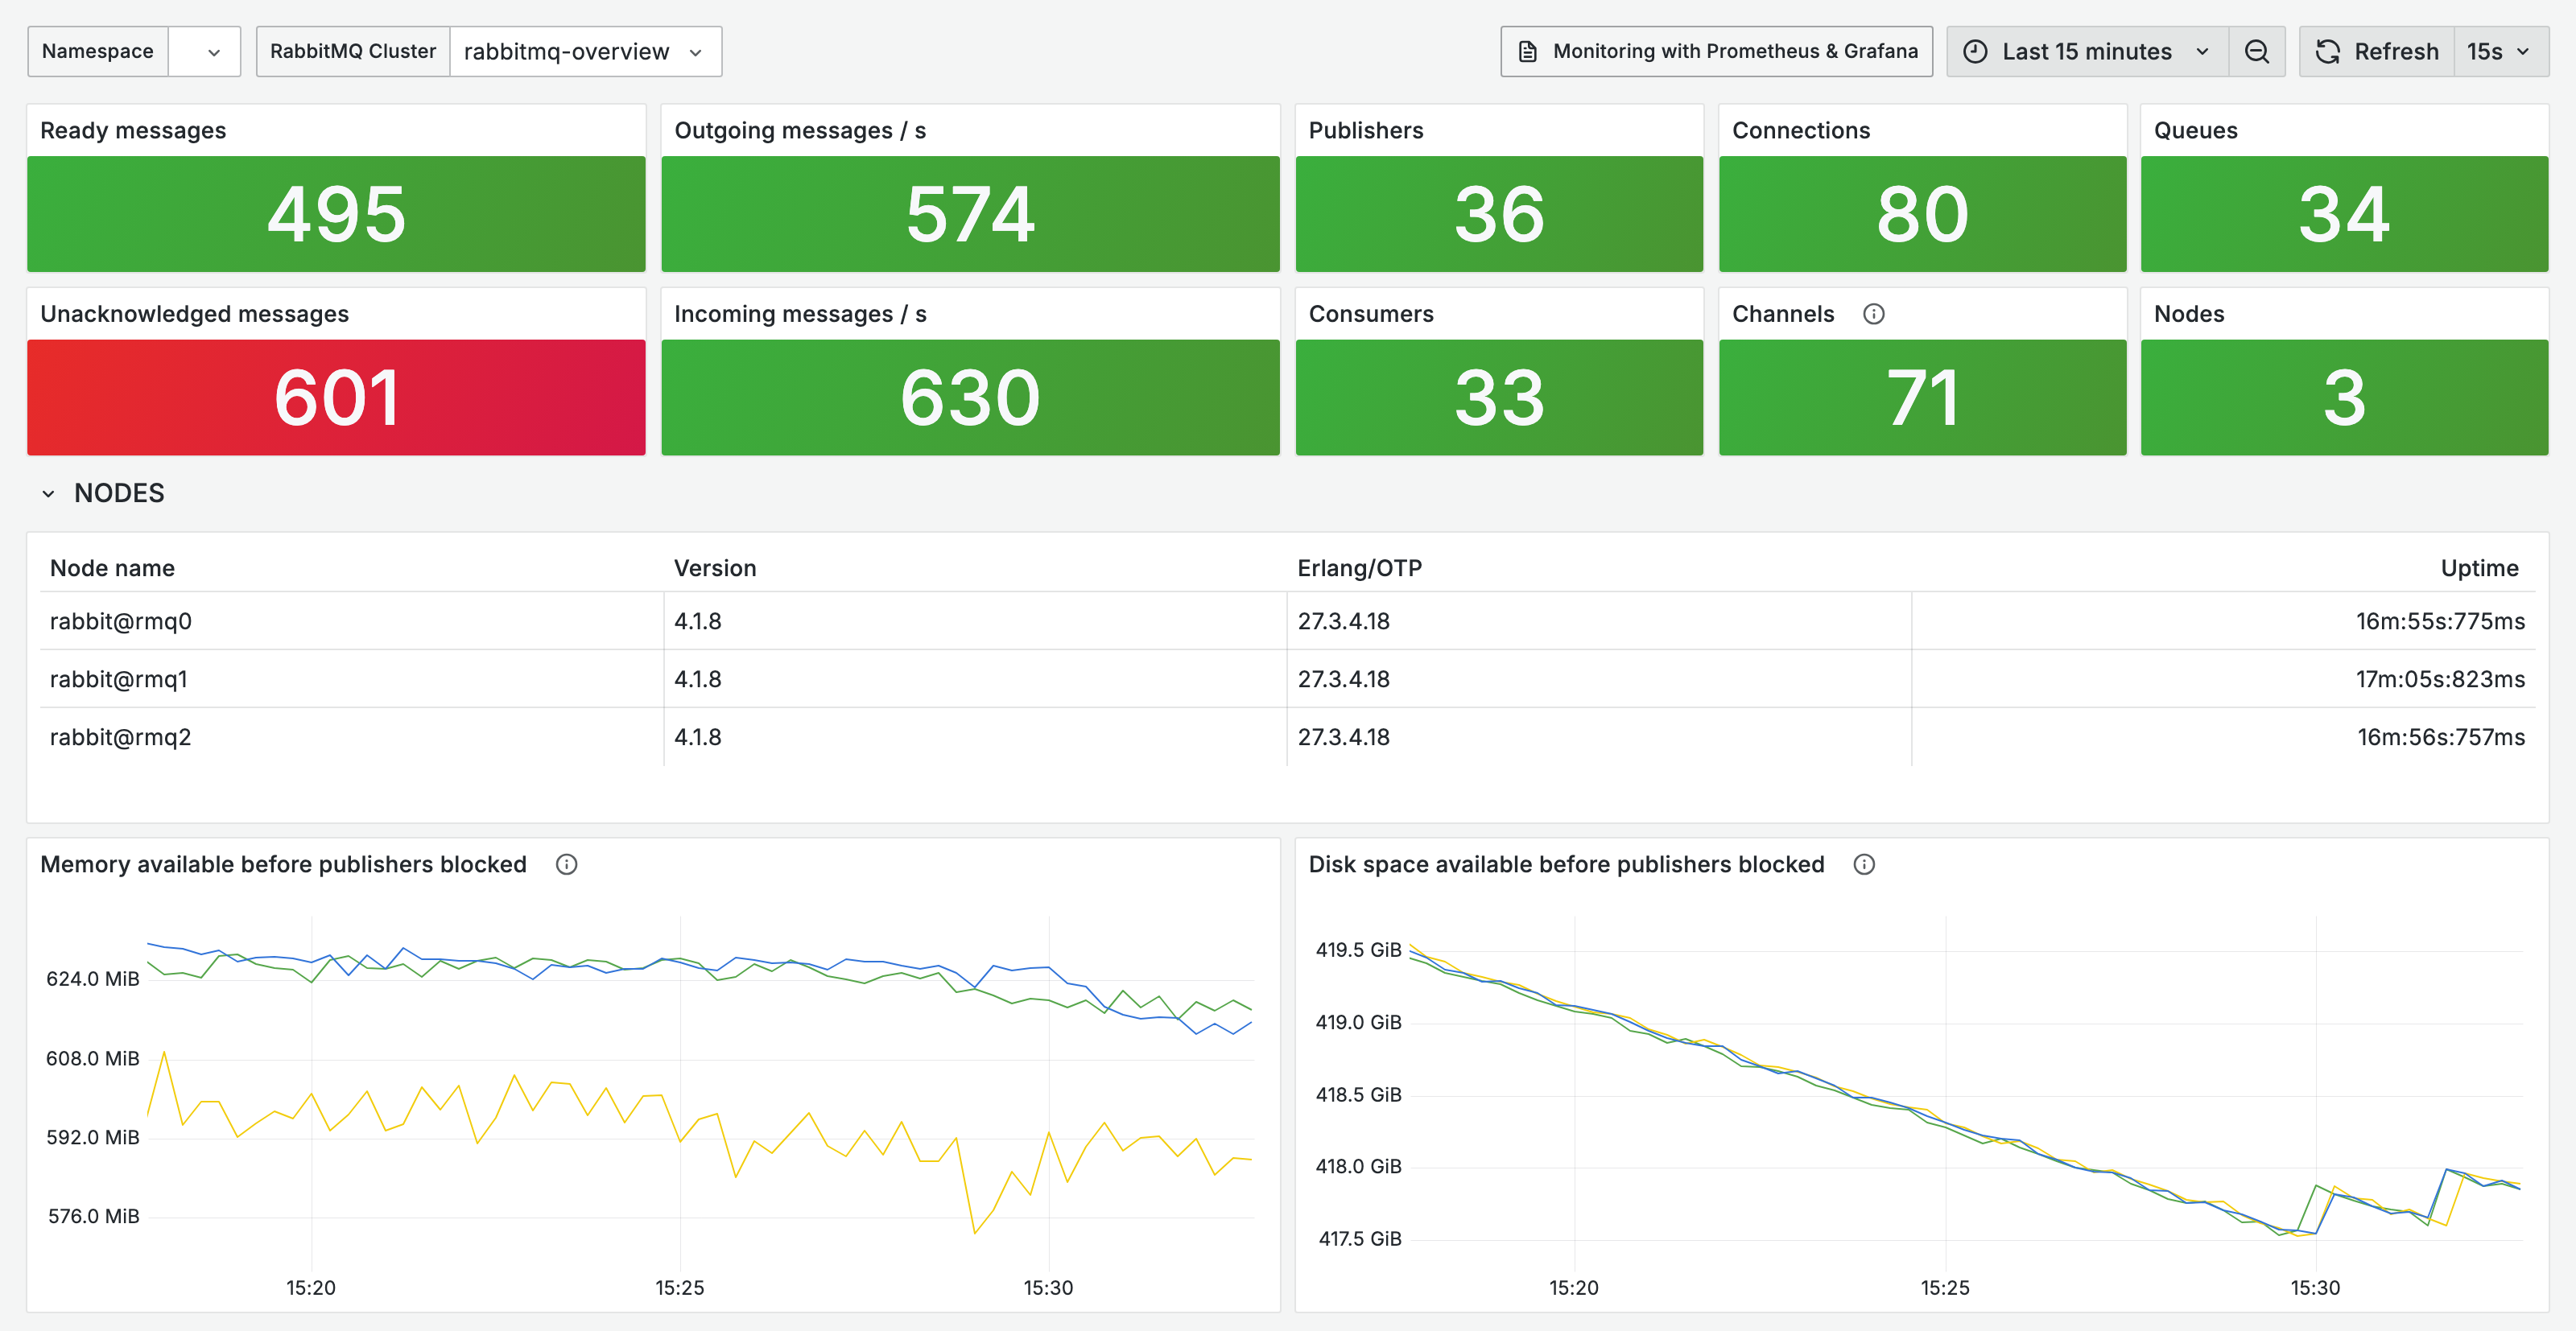
The RabbitMQ-Overview dashboard that ships with the Prometheus plugin, here on a three-node RabbitMQ 4.1 test cluster under synthetic load. The top row is the health summary, and the two panels below the node table show how much memory and disk each node has left before publishers are blocked.
The management HTTP API
The management plugin gives you the web UI, the rabbitmqadmin CLI and an HTTP API with endpoints like /api/overview, /api/nodes and /api/queues. It is the right tool for a human looking at a broker: browse a queue, inspect a connection, check a policy.
It is the wrong tool for continuous metric collection. The management API is a control plane that happens to also serve statistics, and the two compete for the same resources. Under load, exactly when you need the numbers most, the API slows down or times out. We learned this the hard way when we built our own metrics collection on it, and we have since moved to the Prometheus endpoint.
Today an OpenTelemetry collector runs on every node in our fleet and pushes metrics two ways: to our internal observability platform, which feeds the dashboards and alerts our on-call engineers work from, and to wherever the customer wants them, such as any Prometheus remote write endpoint or Grafana Cloud. That shape suits a fleet spread across many regions. A central Prometheus server scraping every node works just as well for a cluster or two in one place. What matters is the source, not the direction: read the Prometheus endpoint for metrics, and use the management API for what it does best, inspecting and managing the broker.
If everything you need comes from Prometheus, set management_agent.disable_metrics_collector = true and the management plugin stops collecting statistics altogether, which removes its memory and CPU cost without taking away the UI.
When to use which
| Need | Use |
|---|---|
| Long-term storage, dashboards and alerting | Prometheus plugin, /metrics |
| Per-object alerts, on queues, connections, channels or exchanges | Prometheus plugin, /metrics/detailed |
| Inspecting a queue, connection or policy right now | Management UI or API |
| Is this node healthy enough for traffic? | Health checks, see below |
Don’t forget the host
RabbitMQ’s own metrics stop at the Erlang VM boundary. Collect host metrics from every node, from an agent on the node or whatever your platform already provides: CPU, memory, disk free space on the data directory, disk IO, network throughput, and TCP connection states. On CloudAMQP, we run the OpenTelemetry Collector on every server for this.
We offer CPU, memory, and disk alarms to CloudAMQP customers at the host level on purpose. The broker’s memory watermark only sees what the Erlang VM has allocated. The operating system sees everything, including the page cache and whatever else is running on the box.
Split CPU into its components, because each one points at a different problem:
| CPU time | Likely cause | What to do |
|---|---|---|
| High user | The broker is near capacity, or one hot queue is pinning a core | More cores if every core is busy, more queues if one is. More nodes help only when queues and connections spread across them |
| High system | Connection churn | Fix clients to reuse connections, or put a proxy in front |
| High IO wait | Large persistent messages, or the message store paging to disk | Smaller messages, shorter queues, faster disk |
| High steal | A noisy neighbour on shared hardware | Nothing in RabbitMQ will fix it. Move to dedicated hardware |
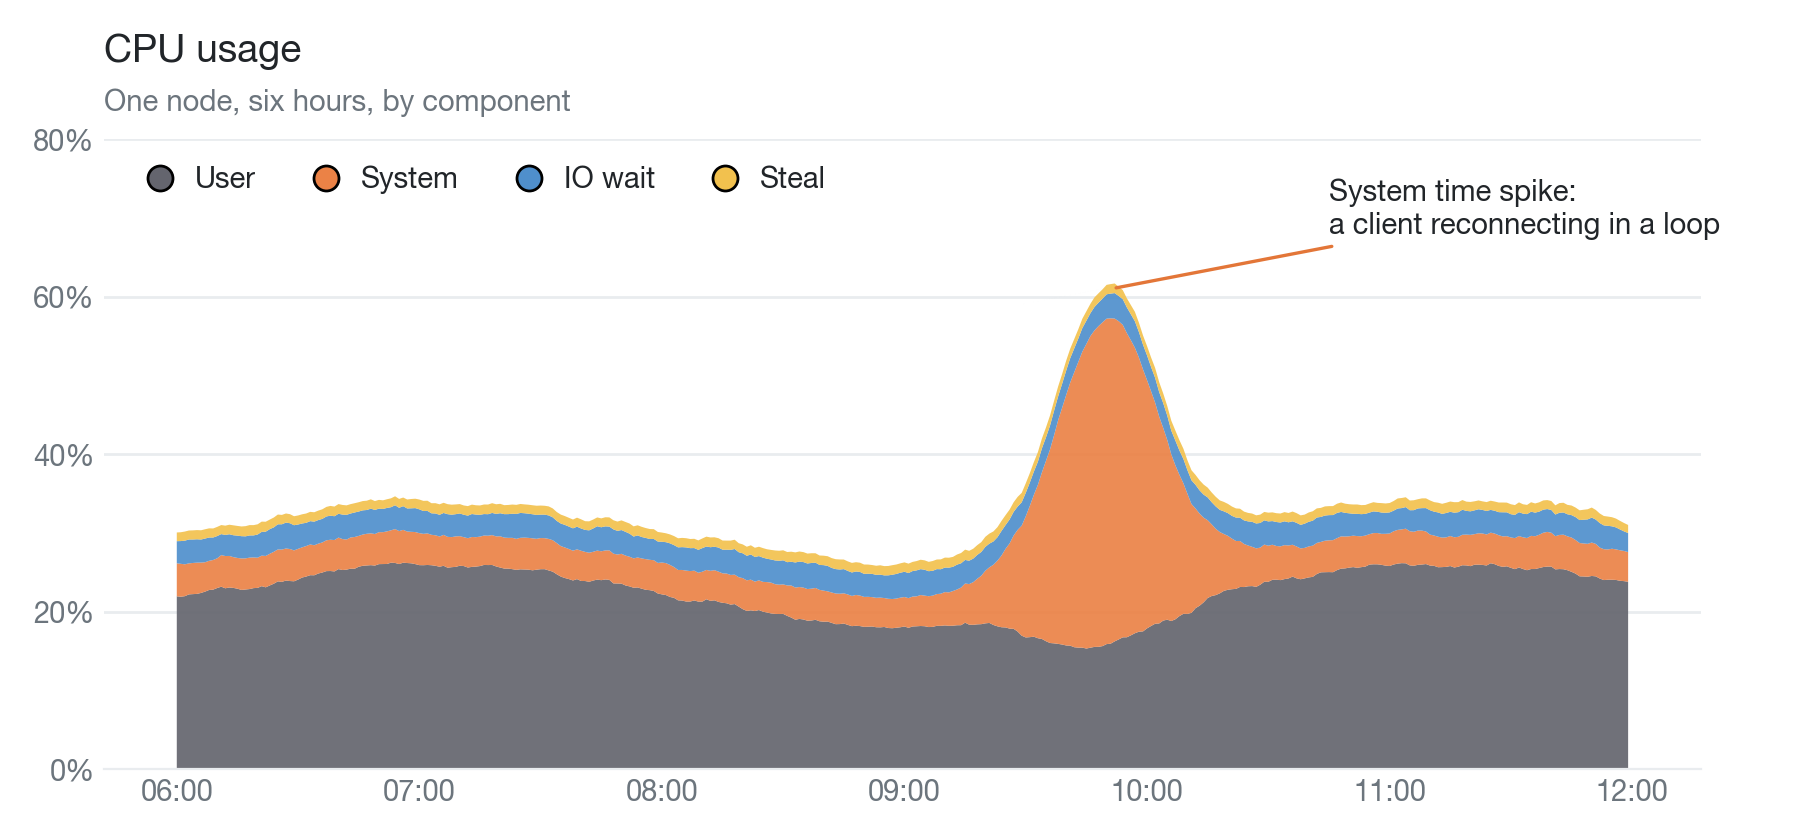
CPU time by component on one node over six hours. A spike in system time with user time unchanged is the signature of a client reconnecting in a loop.
Which RabbitMQ metrics should you monitor?
Every metric name below comes from the Prometheus plugin. The management API exposes the same data under different names.
Resource headroom, before the alarm
rabbitmq_alarms_memory_used_watermark and rabbitmq_alarms_free_disk_space_watermark are 1 while a resource alarm is active. When either fires, RabbitMQ blocks every publishing connection cluster-wide until the alarm clears. Consumers keep working, so the queue drains, but your producers stall with no error unless they listen for connection.blocked. If you have publishers and consumers on the same connection, the consumers stall too, which is why we insist on separate connections for each.
Alert on the alarm itself, but the alert that saves you is the one that fires before it. Watch rabbitmq_process_resident_memory_bytes against rabbitmq_resident_memory_limit_bytes, and rabbitmq_disk_space_available_bytes against rabbitmq_disk_space_available_limit_bytes, and set your thresholds well below the limits, with a time threshold so a spike doesn’t page anyone.
Where the memory watermark should sit depends on what else runs on the machine. The default is 60 percent of RAM, which leaves room for other processes and for the broker to overshoot, since the watermark is where publishers are blocked, not a ceiling. On CloudAMQP dedicated plans, the broker has the machine to itself, so we set the watermark to 81 percent. If your nodes share hardware, it is wiser to keep the default watermark and alert at a lower percentage.
| Limit or alarm | RabbitMQ default | On CloudAMQP dedicated plans |
|---|---|---|
| Memory watermark | 60 percent of RAM | 81 percent of RAM |
| Memory alarm | none | 80 percent of host memory, held for ten minutes |
| CPU alarm | none | 90 percent, held for ten minutes |
| Disk alarm | none | below 5 GiB free, held for ten minutes |
| Disk free limit | 50 MB | 10 percent of the data disk |
That memory alarm tells you the box is full, so add a warning tier at 70 percent to get time to act.
The disk-free limit still defaults to 50 MB, which isn’t much for a production node. On most CloudAMQP servers, the broker’s data has its own disk, so we set the limit to 10 percent of that disk, leaving the broker room for its own housekeeping. If your data directory shares a disk with the operating system and other services, size the margin for them too.
Watch rabbitmq_erlang_processes_used too. Every connection, channel, and queue is at least one Erlang process; the default limit is just over a million, and a node that hits it stops accepting anything. On CloudAMQP, we monitor this on our customers’ behalf.
Queue depth, and its direction
rabbitmq_queue_messages_ready is the number of messages waiting for a consumer. rabbitmq_queue_messages_unacked is the number delivered but not yet acknowledged. Together they make rabbitmq_queue_messages.
Keep every queue short, and ideally near zero. When classic queues still paged to disk, our rule of thumb was to stay below 10,000 messages per queue. Quorum queues and classic queues v2 keep messages on disk, so that memory cliff is gone. A long queue still hurts, though. It means consumers are behind, it costs disk and log work, and it slows recovery after a restart.
If a queue legitimately needs to buffer, give it a max-length or message-ttl policy so the ceiling is a decision you made rather than a limit you discover. This applies to classic and quorum queues. Streams are built to retain a large log on disk, so their size is a retention setting, not a warning sign; the number to watch is consumer offset lag, covered below.
The absolute number matters less than its trend. A queue holding 100,000 messages that drains every night is a design choice. A queue at 5,000 that has climbed steadily for an hour is an incident starting quietly. Set queue alarms from normal peak behavior, not theoretical limits, and alert on sustained growth.
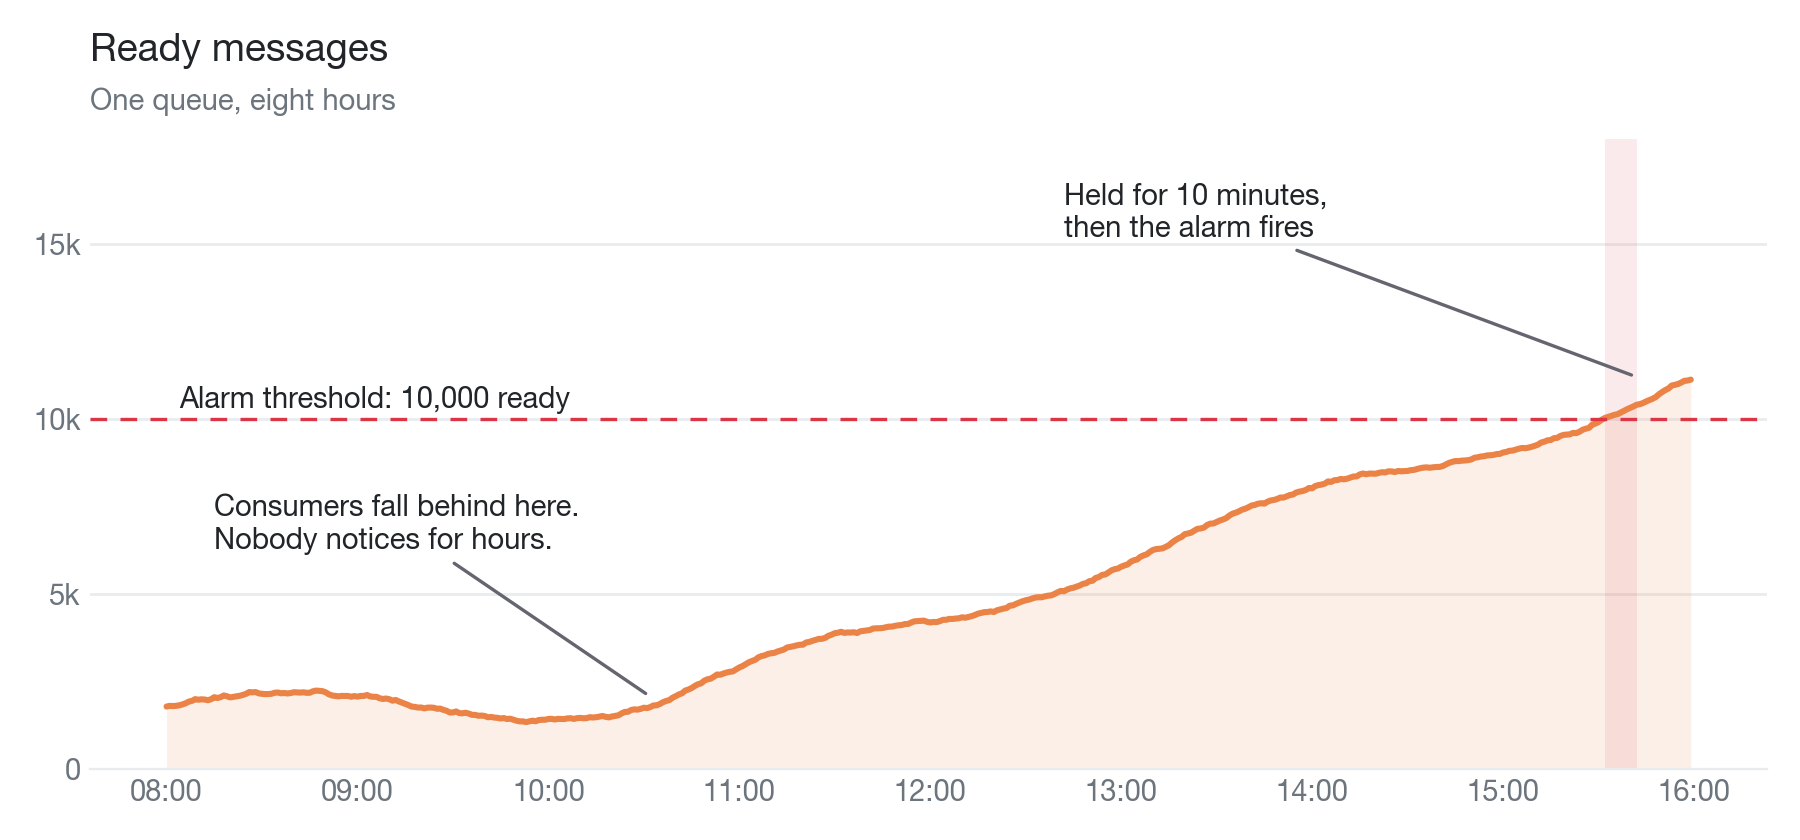
Ready messages in one queue over eight hours. Consumers fall behind mid-morning and the queue climbs for five hours before it crosses a 10,000-message alarm threshold held for ten minutes.
Read ready and unacked together. Ready rising with unacked flat means consumers are not being offered work fast enough, or there are too few of them. Unacked rising means consumers take messages and hold them: they are slow, they crash before acknowledging, or nobody set a prefetch. Unbounded prefetch is the classic version of this, where one consumer takes the whole queue into memory and dies.
rabbitmq_queue_head_message_timestamp tells you how old the oldest message is, if your publishers set a timestamp. That turns queue depth into a latency number, which is usually what the business actually cares about.
Consumers
rabbitmq_queue_consumers is the count per queue. For every queue that feeds a core workflow, alert when it drops to zero. Otherwise, a crashed worker sits unnoticed until the queue alarm fires hours later. Our consumer alarm triggers when a queue has fewer than a threshold number of consumers, so a threshold of zero means “nobody is listening”.
rabbitmq_queue_consumer_capacity is the fraction of time a queue can deliver a message the moment it is ready. At 100 percent, consumers are waiting on the queue. Below that, the queue is waiting on consumers, and you can raise throughput by adding consumers, speeding them up or increasing prefetch. It is a hint, not a law, and both metrics are per queue, so they only appear on the /metrics/per-object and /metrics/detailed endpoints.
Connections, channels and churn
rabbitmq_connections and rabbitmq_channels give you the totals. The counters behind them matter more: rabbitmq_connections_opened_total, rabbitmq_connections_closed_total, rabbitmq_channels_opened_total and rabbitmq_channels_closed_total.
RabbitMQ is built for long-lived connections. Opening one costs a TCP handshake, a protocol handshake and authentication, roughly seven packets before the first message, plus a file descriptor and about 100 KB of memory on the broker for as long as it lives. The pattern we recommend is one connection per process, one channel per thread, and separate connections for publishing and consuming.
Applications that open a connection per message show up as connection churn, high system CPU, and, eventually, a memory alarm. If the client is not yours to change, put a connection-pooling proxy such as AMQProxy in front of the broker.
Three things we check early whenever a cluster is in trouble, because connections are behind a large share of the incidents we see:
- More than 10 connections from the same host may be a connection leak. It is normal when many clients deploy on one IP, so treat it as a question, not a verdict.
- A connection with more than 1,000 channels may be a channel leak.
- A connection with no channels may mean the client is not working properly, since an AMQP connection does nothing without one.
Also, compare rabbitmq_process_open_fds with rabbitmq_process_max_fds. Every connection holds a file descriptor, so a slow leak shows up here long before it reaches the limit. Alert at 80 percent.
Message flow: confirms, acks, redeliveries and drops
The rabbitmq_global_ counters, added in RabbitMQ 3.9, track the message lifecycle across the whole node and cost almost nothing to scrape. Prefer them over the per-channel and per-exchange counters, which can go backwards when a channel closes.
rabbitmq_global_messages_received_totalandrabbitmq_global_messages_confirmed_total: publish rate, and how many publishes the broker confirmed.rabbitmq_global_messages_delivered_totalandrabbitmq_global_messages_acknowledged_total: delivery and ack rate. A widening gap means consumers are falling behind or not acking.rabbitmq_global_messages_redelivered_total: messages delivered a second time. Redelivery is the hidden cost we see most often. A consumer that rejects instantly on failure creates a tight redelivery loop that burns CPU, network, and, on quorum queues, disk. Use a delivery limit and dead-letter the message, or back off before rejecting.rabbitmq_global_messages_unroutable_dropped_totalandrabbitmq_global_messages_unroutable_returned_total: messages that hit an exchange with no matching binding. Dropped means they vanished silently. Any non-zero rate is a bug somewhere.rabbitmq_global_messages_dead_lettered_*_total: dead lettering split by cause, with one counter each forexpired,rejected,delivery_limitandmaxlen, the last meaning the queue hit its length limit.
Watch rabbitmq_channel_messages_unconfirmed too, or the equivalent from your client library. Publishers that pile up unconfirmed messages are the first thing to break when a resource alarm blocks them.
Cluster membership
A node that drops out of the cluster, through a crash or a network partition, stops reporting its own metrics, so a per-node alert can never fire for it. The nodes still running do see it: each one exposes erlang_vm_dist_node_state for every peer it is linked to, and that series drops below 3 or disappears when the peer is gone.
The simplest alert is still on the count, count(rabbitmq_identity_info) per cluster against the number of nodes you run, because it also catches a whole cluster going dark. The surviving nodes log the loss as net_tick_timeout.
Quorum queues and streams
Quorum queues are the replicated queue type in RabbitMQ 4.x. Classic queue mirroring was removed in 4.0, so any HA policy or mirroring check you carry from 3.x is dead weight. Two things about quorum queues need their own monitoring.
The first is disk. Quorum queues keep a Raft log on disk, and its segment files are truncated only after every message in them has been acknowledged. One slow consumer holding a few old unacked messages can pin gigabytes of segments. RabbitMQ 4.3 improved compaction considerably, so on 4.3 this shrinks to a handful of files where 4.2 kept hundreds, but a delivery limit and a consumer timeout are still the right protection.
Alert on disk, and when it grows without queue depth growing, look at unacked messages first. The write-ahead log in front of that Raft log is capped at 512 MiB by default, and RabbitMQ wants roughly three times that size in RAM, so size the cap to the memory you have. On CloudAMQP we size it to the plan’s memory.
The second is quorum itself. A quorum queue needs a majority of its members online, so before you restart a node, run the node-is-quorum-critical health check. It tells you whether taking this node down would leave any quorum queue without a majority. For ongoing Raft health, watch commit latency: rabbitmq_raft_max_commit_latency_seconds on 4.2 and later, rabbitmq_raft_entry_commit_latency_seconds on older versions. Commit latency that climbs usually means one node has disk or network trouble.
For streams, rabbitmq_stream_consumer_max_offset_lag is the equivalent of queue depth: how far the slowest consumer is behind the tail of the stream.
Logs: where the why lives
RabbitMQ logs to a file by default. It can also log to the console, which container platforms expect, to syslog, or to the amq.rabbitmq.log topic exchange for consuming logs over AMQP. Turn on JSON formatting so your log pipeline gets fields instead of prefixed text:
log.file.formatter = json
log.console = true
log.console.formatter = json
Ship the logs from every node, not just one. Label them the way you label metrics, with cluster and node at least, so that a spike on a graph takes you straight to the log lines from that node at that minute.
Log levels are configurable per category. Connection logging at info records every connection open, authentication and close, which is verbose but exactly what you need when you chase churn or a leak:
log.connection.level = info
log.channel.level = warning
Lines worth alerting on, or at least indexing:
missed heartbeats from client. The client stopped talking without closing. A burst of these across many connections points to a network or client-side problem. A steady trickle from one consumer usually means it processes a single message for longer than the heartbeat timeout and its library does not send heartbeats from a separate thread. Fix the interval or the library, not the broker.has timed out waiting for a consumer acknowledgement. A consumer took a message and did not acknowledge it within the consumer timeout, 30 minutes by default, so RabbitMQ assumed it was stuck. Up to 4.2, the broker closes that consumer’s channel with a precondition failed error and requeues every message the channel held, which arrives as a burst of redeliveries. From 4.3, only quorum queues enforce the timeout, and the default response is gentler: the overdue messages go back to the queue, and the broker cancels the consumer with abasic.cancel, leaving the channel open. Either way, the line means a hung consumer, or a job that takes longer than the timeout allows.login refusedandaccess refused. Authentication and authorization failures, often the first sign of a rotated credential someone forgot to deploy.node rabbit@... down: net_tick_timeout. A node lost contact with a peer. In a cluster this is the start of a partition.
Health checks: is this node fit for traffic?
Health checks are not monitoring. They answer one binary question, usually for a load balancer, an orchestrator or an on-call rotation, and they should be cheap enough to run every few seconds. The monitor we run across the CloudAMQP fleet asks every broker a short list of questions:
- Is the Erlang process alive, and does
rabbitmq-diagnostics check_runningpass? - Are the AMQP listeners on 5672 and 5671 bound? If not, we restart them.
- Does
rabbitmqctl --timeout 20 eval 'ok.'returnok? A node that is up but cannot answer its own CLI is a node in trouble. - Does
rabbitmq-diagnostics check_virtual_hostsreport every vhost running? - Before any restart, and regularly on clusters that depend on it:
rabbitmq-queues check_if_node_is_quorum_critical.
Notice what is not on that list. No memory, disk or queue thresholds. Those belong to metrics and alarms, where you get history and trends. Health checks are for liveness.
The same checks exist over HTTP under /api/health/checks/, each answering 200 when healthy and 503 when not.
One caution if you run RabbitMQ on Kubernetes: a thorough check makes a poor readiness probe. During a rolling restart, a node waits for its peers before it reports healthy, so a strict probe never passes and the rollout stalls. Use a plain TCP check on the AMQP port for readiness instead, it passes as soon as the node accepts connections. Skip the liveness probe altogether: a node recovering after a restart can look dead for minutes, and a liveness probe would restart it mid-recovery.
When something is wrong
Metrics and logs are useless without a habit for using them. When a cluster on our fleet misbehaves, the on-call engineer works through the same short list every time:
- What changed? Recent upgrades, plan changes, and customer-side deploys. Most incidents have a cause in the last 24 hours of history.
- Graphs: CPU, memory, disk, and Erlang process count, with the time range widened until the change is visible.
- Which version is this? Old versions have known bugs with known fixes.
- Does the management UI respond?
- Then the logs, on every node.
Once the graphs have told you which resource is in trouble, the usual suspects are few:
| Symptom | Usual causes |
|---|---|
| Memory | Too many connections and channels. A queue leak from temporary queues nobody deleted. Too many queued messages. Very large messages |
| CPU | Connection churn. A burstable cloud instance that ran out of CPU credits. When the time is IO wait, the disk is the bottleneck: too slow for the load, or RabbitMQ writing too much, usually large persistent messages |
| Disk growing while queue depth is not | Unacked messages pinning quorum queue segments. The classic message store’s garbage collection falling behind |
Which RabbitMQ alerts should you set up?
Dashboards are for understanding. Alerts are for finding out. Every alert should have a time threshold, because a spike that clears in thirty seconds is not worth a page, and the CloudAMQP alarm engine deliberately never reports a condition that resolves before its time threshold passes. Start with these, written in PromQL against the Prometheus plugin, and tune the thresholds to your workload:
| Alert | Expression | Why |
|---|---|---|
| Resource alarm active | max(rabbitmq_alarms_memory_used_watermark) > 0 or max(rabbitmq_alarms_free_disk_space_watermark) > 0 |
Publishers are blocked right now |
| Memory near watermark | rabbitmq_process_resident_memory_bytes / rabbitmq_resident_memory_limit_bytes > 0.8 for 10m |
Time to act before the alarm |
| Disk running low | rabbitmq_disk_space_available_bytes < 5 * 1024^3 for 10m |
Same, for disk |
| Erlang processes | rabbitmq_erlang_processes_used / rabbitmq_erlang_processes_limit > 0.7 |
Connection, channel or queue leak |
| Queue growing | delta(rabbitmq_queue_messages_ready[15m]) > 0 for 30m |
Consumers not keeping up |
| Queue without consumers | rabbitmq_queue_consumers == 0 and rabbitmq_queue_messages_ready > 0 for 5m |
A worker died |
| Unroutable messages | rate(rabbitmq_global_messages_unroutable_dropped_total[5m]) > 0 |
Messages silently lost |
| Connection churn | rate(rabbitmq_connections_opened_total[5m]) well above your baseline |
Reconnect loop or connection-per-message |
| File descriptors | rabbitmq_process_open_fds / rabbitmq_process_max_fds > 0.8 |
Connection leak |
| Node missing | count(rabbitmq_identity_info) < 3 for 3m, with your node count |
A node dropped out or the cluster partitioned |
Page on the rows that mean publishers are blocked or about to be, the resource alarm, memory and disk, and on a missing node. The queue alerts depend on the queue: page for one that feeds a core workflow, and use a non-paging notification for the rest.
Treat the remaining rows as tuning alerts at first, keep them non-paging until you know what normal looks like for your workload, then promote the ones that matter. A second tier helps here: the same metric with a lower threshold as a notification and a higher one to the pager.
Summary
RabbitMQ gives you three signals: metrics from the Prometheus plugin, logs from every node, and cheap health checks for liveness. Collect metrics with the Prometheus plugin and use the management API to inspect and manage the broker. Watch resource headroom, queue depth and its trend, consumers, connection and channel churn, redeliveries and unroutable messages.
Keep queues short and connections long. Set time thresholds for alerts before dashboards, and adjust them when you move to 4.x, because the memory watermark, the replicated queue type, and several metric names all changed. Do that, and the memory alarm becomes a warning you actually hear.
Want this without building it yourself? Every CloudAMQP dedicated instance comes with metrics and logs in the console, built-in alarms, and integrations that export both to your own monitoring stack. Create an instance and it’s all there from the start.
 Erica Weistrand