This article discusses the process of conducting performance testing for LavinMQ, including practical steps to perform it on your own, as well as some recent benchmarks for your reference.
The objective of this performance testing is to:
- Measure the volume of messages LavinMQ could process in a given time (Throughput) and what this looks like across different message sizes (16 bytes and 1024 bytes).
- Measure the total time it takes a message to move from a producer to a consumer in LavinMQ (Latency). Again we will test this with different message sizes (16 bytes and 1024 bytes).
Please note
- Our producer, consumer, and broker setup was just for a simple demo — not a real-world config. Tweak it to fit your needs!
- Updated benchmarks for latency on the way. Stay tuned.
LavinMQ throughput and latency
This section will present the throughput and latency values of our benchmarking exercise
Throughput
As metioned earlier, we did the throughput test with messages of different sizes: 16 bytes and 1024 bytes
For each message size, we tested with 3 producers and 5 consumers. The result of our experiment is summarized in the chart below.
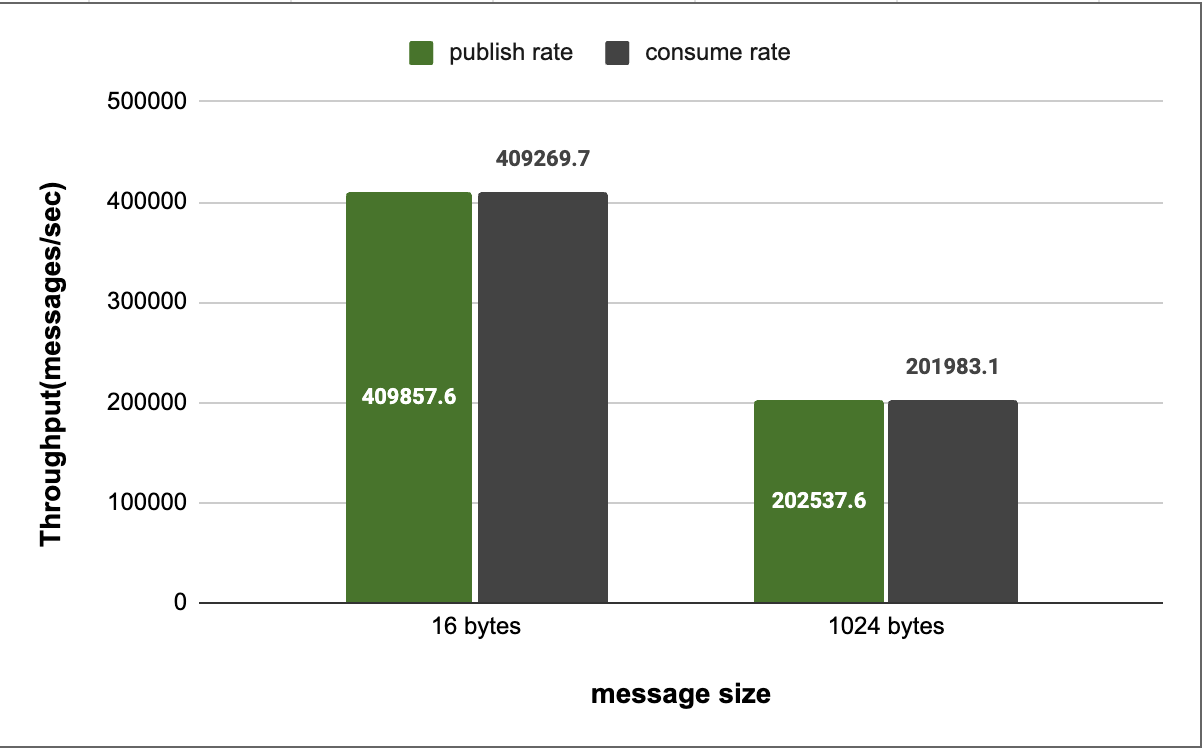
Figure 1 - LavinMQ Throughput
In the chart above, we see LavinMQ performing extremely well, at around 400k+ messages/sec, when tested with lightweight messages of about 16 bytes. We also see LavinMQ performing well at around 200k+ messages/sec, when tested with medium sized messages of about 1024 bytes.
Latency
The table below shows the latency distribution of LavinMQ for different message sizes– because generally, latency data does not have a normal distribution, reporting it in terms of percentiles gives a more holistic picture.
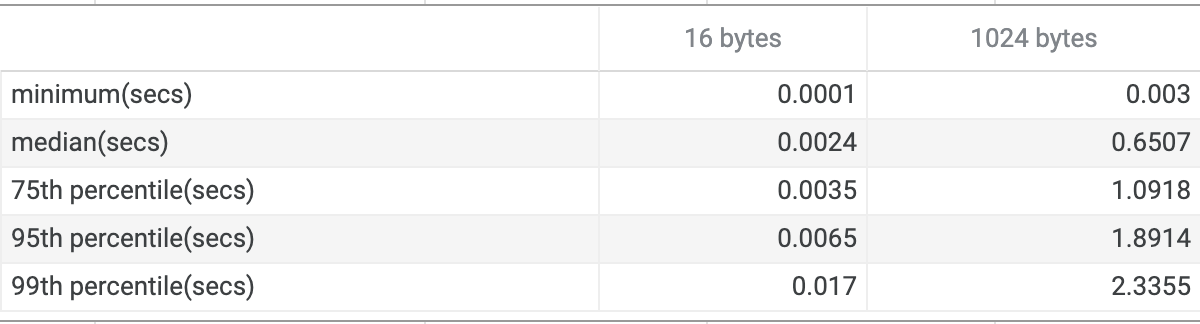
Figure 2 - LavinMQ Latency Table
Even though the table above reports the latency data from the minimum all the way up to the 99th percentile, we will use the 50th percentile/median to do a quick analysis of LavinMQ’s latency performance.
The median is a very fair metric to look at because it represents the central tendency of a distribution – what this means is, if we have a distribution where the median is, let’s say 7.5, then a decent percentage of the values in that distribution would be slightly above or below 7.5
The chart below shows the median latency of LavinMQ across messages of different sizes.
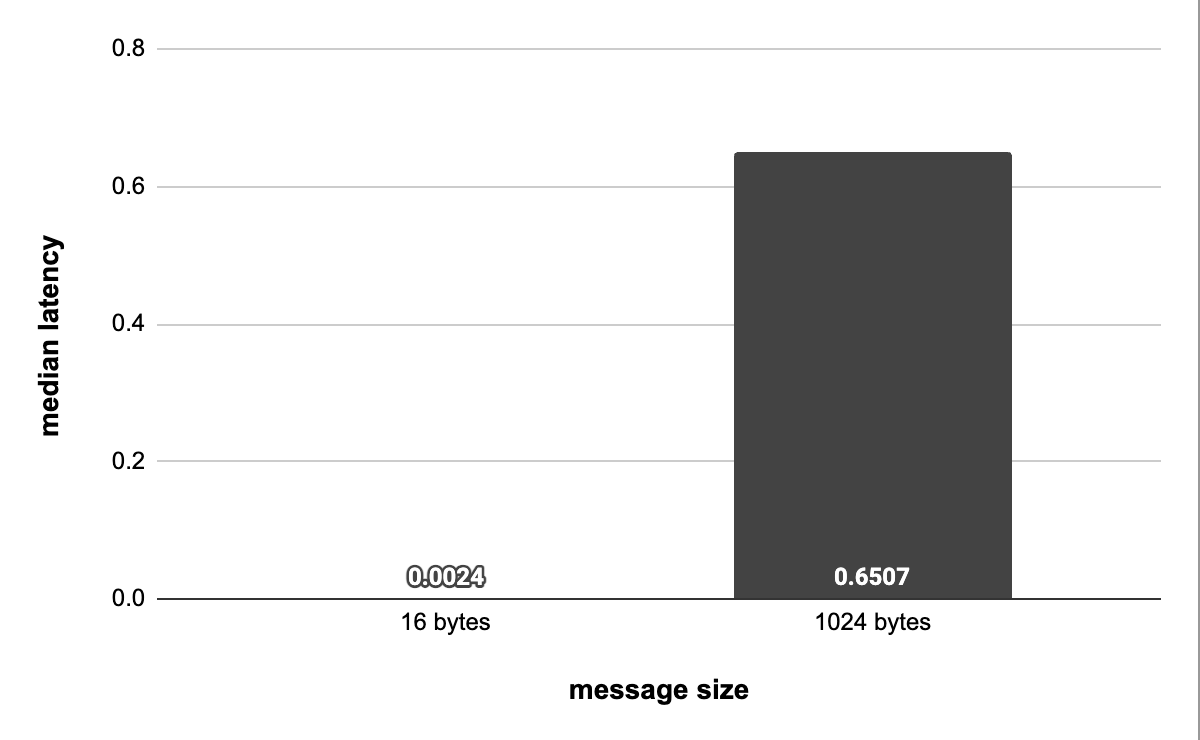
Figure 2 - LavinMQ Median Latency
LavinMQ benchmark methodology and tooling
This section will cover the server configuration we used to run the benchmarks, and generally how we arrived at the throughput and latency results we got.
Throughput: test bed
For the LavinMQ throughput test we used two instances of AWS EC2 servers with EBS GP3 drive – precisely m6g.medium(a single vCPU, 4GiB RAM). Both instances ran in a VPC.
To execute the benchmarks, we ran the load generator (lavinmqperf) on one of the EC2 instances and the LavinMQ message broker on the other instance – simply to avoid having the load generator and the broker running on the same machine and by extension reduce the effect of resource sharing.
The primary function of the load generator, lavinmqperf is to spin up makeshift producers and consumers. It then uses the producers and consumers to generate tons of messages, publish them to the broker, and then consume the messages eventually.
What broker the load generator publishes its messages to, the number of producers and consumers it spins up, and the size of messages it creates, always depends on the command it is being passed.
For example, in our case, the command below tells lavinmqperf to spin up 3 and 5 producers and consumers respectively, create 16 bytes messages, and forward the messages to the broker whose uri was specified in the command.
lavinmqperf throughput -z 120 -x 3 -y 5 -s 16 --uri=amqp://dummy-lavinm-server-uri
In the command above,
-z 120
tells lavinmqperf to run the throughput test for 2 minutes = 120 seconds.
Latency: test bed
The major change we made here, as per our configuration, was the
switch from
lavinmqperf
to
rabbitmq-perf-test
as our load generator. This is mostly because,
rabbitmq-perf-test
reports latency out of the box and
lavinmqperf
doesn’t.
Other than that, we used the same machines as the ones used for the
throughput test – only that now, one of the instances runs
rabbitmq-perf-test
instead of
lavinmqperf.
Again, the
rabbitmq-perf-test
will spin up the number of producers and consumers, create the
message size and connect to the broker we pass to it in a command
that’s similar to that of
lavinmqperf.
The limitations of our approach
At the outset of this article, we explicitly stated that our producer, broker, and consumer configuration is not representative of real-world scenarios.
To elaborate, both
lavinmqperf
and
rabbitmq-perf-test
create consumers and producers on the same machine, which is
atypical in reality. In practical settings, it is more common to
have hundreds of producers and consumers distributed across multiple
machines.
Conclusion
This article has demonstrated LavinMQ's performance across messages of varying sizes. We have also published a similar article that details RabbitMQ's performance benchmarks.
Ready to spin up a LavinMQ instance? Create a free LavinMQ instance at CloudAMQP.
Leave your suggestions, questions, or feedback in the comment section below or email contact@cloudamqp.com