RabbitMQ Summit 2018 was a one day conference which brought light to RabbitMQ from a number of angles. Among others, Gerhard Lazu & Wayne Lund talks about what it looks like to succeed with RabbitMQ in production.
Come and join us in exploring what it looks like to succeed with RabbitMQ in production. We will cover 3 different enterprise messaging implementations that rely on RabbitMQ for:
- Financial trading
- Vehicle telemetry
- Monitoring medical equipment
Real-world RabbitMQ deployments
This talk is about real-world RabbitMQ deployments. Having spent many years helping and learning from enterprise customers, mostly Pivotal but also VMware and other companies, and having learned from users on the mailing list and having collaborated with them, there are many things that seem to have in common and seem to have been helpful. I'm here today, to share some of those things that I hope that you can apply straight away.
The RabbitMQ Broker works in every case
The one thing which became obvious, after year 1 and year 2, is that the RabbitMQ broker works in every case. RabbitMQ broker is very flexible. It's very mature. The flexibility, sometimes, it works not in its advantage. Let's put it like that. Michael was commenting all the things that you can do with queues and some things you should never attempt to do and yet you still can. That tends to be a source of many, many issues.
The one thing which I really like about the RabbitMQ broker is that it gets better with every release, which every patch release, which roughly ships every month. There are constant improvements being delivered in the broker every month. That's great.
There are some very big improvements such as the quorum queues which you have no idea how big it is. Even I don't know how big it is because I haven't worked as closely with it but it's a big improvement. They tend to ship roughly every year.
Applications, runtimes and clouds
The limitations of RabbitMQ and more important to the applications are better understood and we're pushing them further. We'll cover some of them. But there is one thing that is not problematic but things get interesting. When it comes to applications, their runtimes and the AZs where those applications run. The broker doesn't work in isolation. It has all these clients, all these services that it needs to talk to. That's typically when problems start.
Some applications are engineered better than others. Some are very good. Some are very bad. Some are terrible, like you should never put them in production. It's what it is.
The biggest problem is that some applications are built and they can never be improved, so there’s no amount of configuration or tuning that you can do in RabbitMQ to make up for poor applications. If you can't change your application, there's nothing RabbitMQ can do for you. Those are really tough discussions.
The application runtimes are very diverse. We live in an age where you can write code in anything you want. it doesn't really matter. You just push it to the cloud and it works. A Java runtime is very different to a Golang runtime, to an Erlang runtime.
And because everything is more and more magical and easy, there are some trade-offs to be had there. If you're sharing a host with many containers, and those containers run within VMs, and the VMs run on a server, you have all these layers of complexity, who knows where the problem is.
Another thing which we keep coming across - not as often these days but definitely two three years ago, is you have this CapEx vs. OpEx. CapEx is where an IT infrastructure - an IT department bought some hardware. We won't mention any names. They spend millions on it so it better run good and we better get the most out of it. It tends to get overloaded. It tends to get maybe not ideal but you have the investment so you have to make use of it. OpEx, it's much, much better where you can, if it's not the right thing you just put your credit card and get a bigger instance.
RabbitMQ is a river, not a lake
We keep mentioning this over and over again. This precedes my time. RabbitMQ is not a database. RabbitMQ is a river. It's not a lake. Messages should flow through it constantly and yet some people or some applications don't seem to do that and then you need to expire messages. You need to do all sorts of things which just complicates things greatly. You're asking the broker to do all this work for you, to do all the metrics, all the things and then, the messages goes away. So, all this work for nothing. The one thing which I would say is, if you can, keep your queues empty. I know it's not practical in all scenarios but that's when RabbitMQ shines - when things just flow through it. It is a message broker. Again, it's not a database.
Low-latency RabbitMQ
Let's come to some specific workloads, some specific requirements from RabbitMQ. This is a low latency. We call it a low-latency RabbitMQ - some considerations and some challenges when it comes to low latency messaging with RabbitMQ. We came across this use of RabbitMQ in the context of financial trading. The specific use case had to be with four financial markets and 7900 financial instruments.
All it means in terms of like the four financial markets were four exchanges. The financial instruments were routing keys. And you had all these messages which had to flow through RabbitMQ very, very fast. You had 30,000 messages per second. The messages were fairly small. They were basically keeping track of changes in the financial instruments like all the price changes, basically. The goal was to consume every message within 1 millisecond. If a message took more than 1 ms, it was no longer useful, like they had to drop the message. The system would lose money if messages will take more than 1 ms.
Publisher → Broker raw network latency
Where do you start? You deploy RabbitMQ. You run your application and it's slow. What do you do? Well, the first thing that you should do when low latency is important is look at your network.
| Cloud | AVG | MAX | STD |
|---|---|---|---|
| A | 0.49ms | 1.62ms | 0.12ms |
| B | 0.25ms | 0.69ms | 0.07ms |
| C | 0.12ms | 0.15ms | 0.02ms |
publisher:~$ ping -s 1000 -c 100 broker
, by
Gerhard Lazu.
We have three providers - Cloud A. Cloud A, when it comes to the raw network latency, the average latency is 0.49 ms. This is before RabbitMQ steps in. It's like layer 3, layer 4. The maximum latency is 1.62 ms which is really bad. There were some spikes.
This is a public cloud. I won't mention any names. In a public cloud, different zones, containers - all sorts of stuff, you had spikes which were so big that there's no way RabbitMQ could have processed that message within 1ms. There's no way because your latency was 1.62.
Cloud B is slightly better. But Cloud C is what you actually want. The publisher to broker - the network latency from publisher to broker, the maximum was 0.15 ms which is perfect. But I would like to emphasize the standard deviation, 0.02 ms. This was predictably low latency which is key. Low latency is not sufficient. It has to be predictable. It has to be constant.
Broker → Consumer raw network latency
Now, it's not enough to measure the latency from the publisher to the broker. You also have to measure the latency from the broker to the consumer. In this case, Cloud C again wins, 0.09 ms. That's amazing to have to have such low latency. The maximum latency for Cloud C is lower than the standard deviation for cloud B and A and that is significant.
Publisher → Broker → Consumer
Put together, Cloud A 0.87 ms. that's the majority of the 1 ms. It's only spent in the network stack. There is no way your messages will flow within 1 ms because RabbitMQ needs some time. Your publishers need some time. Your consumers need some time. Cloud C is 0.24 ms, much better. We can do some work with that.
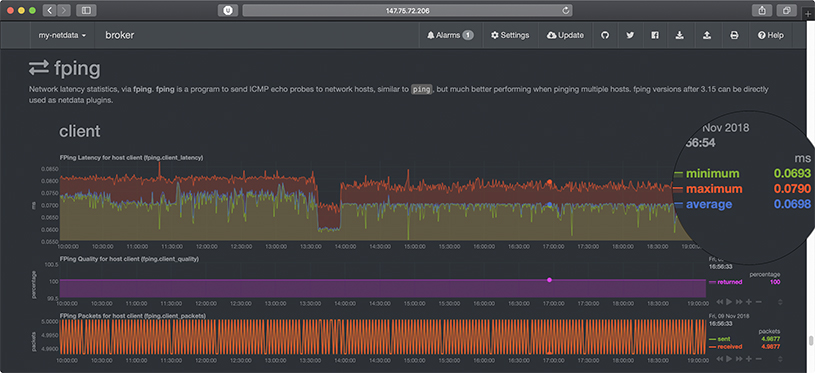
You would think that point in time latency measurements are enough. They are not. You need to continuously monitor your network latency. This is not just for like low-latency messaging. This is for when your cluster has partitions.
How do you know that it's due to RabbitMQ or to your network if you don't monitor your latency? In this specific case, we can see that the latency is nice and consistent, 0.08 ms. We can see some dips which is okay. This is fine. The problem is when you have spikes and they're very high. You need to be aware when that happens because your messages might start expiring, like your messages are not making it through, why? Because of high latency - network latency.
1KB Message, 1 Publisher → 1 Queue → 1 Consumer
This is the first thing that you can do today in RabbitMQ and you will have a good time. You'll have low-latency messaging with it. Publisher confirms. Publisher confirms. Keep the data buffers empty. There are many buffers between your application and the queue, never mind the consumer. Many processes. Many ports. Many things going on.
If you do not use publisher confirms and send messages to one queue as fast as possible, you will peak. In this specific case, 60,000 messages per second. But look at the latency, the 99th percentile is 3000 ms. That's crazy high. That's like if you publish confirm every message you can only push 8100 but the latency is 0.19 ms.
In our case, we had to push through 30,000 messages per second. The optimal publisher confirm configuration for us was every 13 messages. I wanted to make it 12 to match today's date. It's every 13. It's a lucky number.
There's a problem. Look at the line. The message latencies, the 99th percentile is just under 1 MS ms. There is very little headroom. Anything goes wrong and you start dropping messages. Not good. The message latency, top corner, 979. Very, very high, distribution, so on and so forth. There are many things which you should keep track.
By the way, if you want to know how to do this or where this is available, this is publicly available. Talk to me after.
1 Queue, Confirm every Message, 1 KB Message
Moving on, we know that if we publish confirm every message, we have a very low latency but the throughput suffers. I'm wondering, “What would happen if we make use of Erlang’s concurrency and we ran more publishers and more consumers? Will the latency stay low?” And it does. If we have five publishers and five consumers, we already achieve our 30,000 messages per second. But look at the latency, 0.27 ms compared to 0.98 - what we had before. A big improvement.
And, sure enough, if you have 20 publishers and 20 consumers going into a single queue, look at that latency 0.59 and you're still achieving 65,000 messages per second. Great. Obviously, this can be counterproductive. It's very important to measure. If you do 50, your throughput goes down and your latency goes up. Always measure. These numbers might not be optimal for you but they were optimal here.
This is what it looks like when you have 20 publishers and 20 consumers. You confirm every message. This is what the flow looks like. You have under 600 microseconds, the 99th percentile. You have high throughput. Everything is great. This is just one queue by the way. No sharded queues. No multiple queues. Just one queue.
30,000 messages/s with Queue Mirroring
Most of you use queue mirroring, maybe. Most of the customers that I work with, they use queue mirroring by default. This is the latency that you get when you have one queue mirror, 20 ms, 30,000 messages. You add another queue mirror, it doubles. And it gets much, much worse from here.
Bless a RabbitMQ
[Wayne enters the stage.]
In my role, with Pivotal, I work with customers in either of pre-sales or after they’ve purchased in a consumption, helping everybody's subscription today. And so, we're helping them to consume the product.
In the case of this large enterprise customer, they were trying to implement a large-- it was an MQ broker replacement. They had various types of workloads. Those workloads included the fact that they were using other of our services that also use RabbitMQ. In their case that was Spring Cloud Services which is a set of services that we have in developing cloud-native services.
They went through all the generations of - we call them tiles which is our package release of RabbitMQ that runs on CloudFoundry. I really don't get involved in RabbitMQ unless it's running on CloudFoundry. In their case, they were using it with Spring Cloud Dataflow, Spring Cloud Streams and Spring Cloud Services all using the RabbitMQ underneath as well as all the applications that they were migrating from MQ broker.
They have been with us now for about three years and in our early days of working with them because there was so much effort and energy being applied to replace the old workloads onto RabbitMQ broker. We actually had weekly meetings with them of which some of those Gerhard was involved and listening to them explain their performance or reliability issues that were coming up with RabbitMQ.
In our early release of RabbitMQ, on PCF tile, it was pre-provisioned. We use a provisioning tool underneath Cloud Foundry that's called Bosh. Bosh is really a VM. For simple terms, a VM manager. They would manage the clusters that we spun up. Those pre-provisioned Rabbit clusters would basically provision a new client by distributing or provisioning a Vhost for them.
And so, it was a multi-tenant environment. And in their particular scenarios where they're trying to run Spring Cloud Services and Spring Cloud Dataflow and then also their applications on RabbitMQ, they were finding that multi-tenant model would be very hard to manage.
And so, it used to look like I'm showing on the right where the applications used containers. They're all deployed in containers and then the Bosh releases of Rabbit were managed VMs and it would go through an HA proxy and then hit the clients.
That was just background to introduce that. What we wanted to help them with recently was the fact that our new generation of tile, as referred to as on-demand broker. The on-demand broker brings up a separate cluster per request for provisioning that isolates that workload. They had done this previously with almost a hack or a workaround that we had that we’ve called tile replicator.
The tile replicator would bring up another multi-tenant environment. They actually had three that they were running. They separated out spring cloud services that were using RabbitMQ from their transactional workloads, from their more transient type of workloads. They had three that they were running.
And so, they wanted to test how the RabbitMQ would perform under two new scenarios in their new data center. One was the fact that they were migrating to on-demand RabbitMQ broker which would provide the isolation they'd been waiting for. The second one is they wanted to introduce a product that's shared by our sibling company, VMware, that's called NSX-T which provides a rich policy-based security and network isolation for container-to-container networking.
With a meeting at with Gerhard, he introduced them to this project that - it's accessible to all of you. It's called the Workloads Project. So, we went into the data center to help with that.
When we went in the new data center, there was one other issue that was very interesting to them and that was the topic of how could they distribute to RabbitMQ cluster across Availability Zones. They had read a paper that was authored by Dan Carwin, that’s sitting down here, on the impact of Availability Zones and RabbitMQ clusters. What they wanted to do is avoid the network partitioning or split brain, as some people call it. And so, the advice that was given, the article that Dan wrote, the white paper, was basically addressing AWS, Google and Azure but didn't really say a lot about vSphere. We suggested they used the Workloads Project and test it for themselves because, given the right situations, vSphere could distribute RabbitMQ nodes across Availability Zones. And so, that was part of what we were testing.
Running the Workloads Project, I've mentioned this already, we ran three of the workloads in the project. The situation that come to us is that they said, “We want you to tell us what type of topology you need to run with your RabbitMQ, so just give us the right answer.” We said, ”We'd rather you run the Workloads Project and you tell yourself whether you have the right topology and whether this is working.”
In a particular case, I think it was the Lazy Queue one, the LQS, was actually done with discussion with Gerhard listening to the client’s description of their workload. And then, these use cases are laid out for them. The LQS was the lazy queue implementation. The DQ was durable queues. And within that pages, if we took you out there, you'd find that it describes what physical configurations are being used, under what network. It actually shows you typical, off of our continuously-running performance test, what Datadog is revealing through monitoring those executions.
In our case there was also an implementation that allowed us to do what we call CF push for Pivotal CloudFoundry. You can push the application out using performance test parameters. You can affect everything that you saw in earlier demos today - number of consumers, number of publishers, delays on messages, and 50 other parameters that you can pass. We actually ran that with this.
In this case, on the final testing that we did with this client, what they really wanted to do was test the saturation in the network. We used the non-durable queues with autoAck that would basically keep everything in memory, write nothing to disk, and flood the network.
In their case, I don't know if you can see this but there's 210. This was all Availability Zones. They spread a RabbitMQ cluster on vSphere across the Availability Zones. In the bottom one, it showed where it was a single Lazy Queue or I may have that mixed up.
What we found out, by running the Workloads Project, in their configuration, using the admin tool, that there is very little difference in the executing on spreading the nodes across the Availability Zones and having it all on a single Availability Zone. There was a slight degradation but not enough to bother them.
In their particular situation, they wanted to be able to strike their RabbitMQ nodes across Availability Zones. That will not fit others. In fact, that's oftentimes one of the more frequent questions that comes in to our support: “Why am I having a split brain or a network partitioning?” Because they've spread their nodes across their AZs which is not typically a good idea. In this particular vSphere configuration it worked. This is just one example of how we used actual testing for the client to be comfortable with the RabbitMQ configuration that they wanted to use in their production environment.
High-Throughput RabbitMQ: Vehicle Telemetry and Events
[Gerhard enters the stage.]
Wayne gave you a taste for high throughputs when he talked about how many messages per second to saturate the network. I want to also talk about a high throughput RabbitMQ deployment. This is the context of vehicle telemetry and events coming from cars.
Real-World High-Throughput RabbitMQ
This specific RabbitMQ deployment had to handle peaks of cars. We have two rush hours, morning and evening rush hour. When those peaks would happen, you'd have 1 million vehicles all pushing all sorts of events. Even though the messages per second weren't as high per se, it had only like 10,000 per second, the problem was their size. They were very big messages.
The other problem was that there were two services consuming those messages. You were effectively multiplexing the ingress. Those external services, they would have a maximum throughput which would be lower than the ingress rate. This is a problem because what do you do with the extra messages coming in?
In this case, the right thing for this customer was to buffer those messages. If you have 300 million messages. That's a lot of messages. The expectation was that all of them will eventually be consumed, that rush-hour peaks were going to go away, and those back-end services would also be continuously improved. I obviously can't mention any names but the customer is present in this room.
And so, I'm basically saying the same things again because even though this message was delivered some time ago it didn't make it through the entire org. Hopefully, if I'm talking about this on stage it's official and everyone listening to this talk will do the things that we recommend them do. We talked about applications.
Does RabbitMQ have enough network capacity?
The first question that you need to answer is “Does RabbitMQ have enough network capacity?” In this case, there was a lot of data coming in and a lot of data going out and you have to count both data coming in and data going out. Because RabbitMQ is a river, those messages have to eventually go out. It's not sufficient to provision sufficient capacity for incoming messages, you also have to count outgoing messages.
Also 5+5, you would think it's 8 but it's 20. The reason why it's 20 is because you need extra capacity. What happens if a load balancer goes away? Are you going to drop half the messages or not receive? What's going to happen? So, you always need to have more capacity.
These were just message bodies. There is a AMQP overhead. There is TCP/IP overhead. There are lots and lots of things which add overheads. You can't just count the message payloads and nothing else. The load balancers, if you have load balancers from the RabbitMQ, it doesn't matter how fast the RabbitMQ node network is, you need to do the same for the load balancers.
I would argue that you might not want load balancers in front of RabbitMQ but that's just my perspective and it's very contentious, so let's discuss after this talk. I enjoy that discussion very much.
High Availability Proxies.
You can see here that we were measuring the ingress and the egress for the High Availability proxies. There are two High Availability proxies. That's roughly 7 gigabits per HA proxy times 2, 14 gigabits. They were the ones which had the highest network throughput.
Send Messages to fast disks
You have all these messages coming in. You have sufficient network. Can your disks cope with those messages? Or can your memory cope with those messages? There is a lot of data coming in. What do you do with them?
Our recommendation was to send messages straight to disk. You would use lazy queues. What you do not want to do is mirror those lazy queues because that adds a lot of network overhead. And, especially, do not automatically synchronize lazy queues which have lots of messages in them. It's very bad. Let's talk about that as well.
It's not sufficient to just manage disk throughput. There are two valleys that you need to keep in mind, the disk throughputs which is maybe bytes, megabytes or whatever it may be, and the IOPS. The throughput might be sufficient but your IOPS might not. You need to be aware of both values.
Our friends from Intel are here today. They have a very good story about Intel Optane NVMEs. They’re amazing disks. I can tell you more about them. We've done some benchmarks. They're great.
We can see here the disk throughput. We know what our limits are - very important. We know where we are within those limits, both for bandwidth and IOPS. If you don't measure these things, like finger in the wind, it doesn't work. It really doesn't work.
You can also see the RabbitMQ messages which are queuing up. We have 150 million and slowly growing. What's your capacity? Are you within capacity? What's happening?
Also, we can see the memory usage is nice and flat and stable through all nodes for the entire duration of this peak rush hour. It's a simulation.
Persistent Message Store
Most of you might not know this but there is an Erlang process which is responsible for persisting messages to disk. There is only one. In 3.6, there used to be one per node, so all the queues - everything on one RabbitMQ node would go through this one Erlang process that would flush messages to disk - would write messages to disk. And that would get overloaded in our case.
Since 3.7, there is one per vhost. The work that we did had somewhat an impact on our considerations for the persistent store.
How do you know when the message store is under pressure? You might not have seen this or might not have noticed this but your queues will enter in a flow state, that means that the message store is exercising back pressure on the queues. There is a very good blog post, it goes way back when, which explains the back pressure in RabbitMQ. The message store is the last link in the chain which exercises back pressure.
Metrics when many Connections, Channels and Queues
By default, there are too many metrics collected but users expect that and users like that. And that's like one of RabbitMQ’s great features. You have the UI and you can see all the metrics. That's great. But, if you have many connections, many channels, many queues, it might not be such a good thing.
Actually, in 3.6.7, the entire metric system was rewritten because one node used to handle all the metrics and would continuously crash over for this specific customer and we have two team members which did an amazing work on that. It took them quite a lot of toil to get it done but it's so much better since 3.6.7.
Do you need to generate metrics every 5 seconds? The fact that the UI needs to refresh every 5 seconds and is expecting fresh metrics, you might not need to capture them every 5 seconds. It might be bad for your use case.
Do you need to keep them for up to 24 hours? Okay. You have buckets and you have rotations, but do you need them? My preference is to extract all the metrics into purpose-built systems which are external to RabbitMQ. It will save you a lot of trouble. It definitely works in this case.
User Sharded Queues for high throughput
RabbitMQ sharding has been mentioned today, I think, at least once. RabbitMQ sharding works very well but it's not the first thing that you should go to, depending on your use case. In this case, it did make sense. We wanted to have a single logical queue. You can't define it. It's just there in the system. You use it. And the queue is backed by queue shards that run on every single node.
The queue is always available as long as there is one node available, if you don't have pause minority. Let's talk about that as well, if you want.
The best thing in this case was that the publishers and consumers, they publish and consume from queue shards local to their node. This will limit inter cluster traffic. It's really good.
You can see here how we have all these different nodes that have a very even spread when it comes to ingesting messages and delivering messages. It's a nice even spread. RabbitMQ sharding makes it super easy.
High Scale RabbitMQ
With that, we go to the last workload type. The last RabbitMQ workload talks about high scale. It was in the context of medical equipment.
A real-world high-scale RabbitMQ
The problem here were the number of connections and, more importantly, number of queues. There were 100,000 queues. Every medical device had one queue. There were many long-lived connections. The throughput was rather low, only 300 messages per second and they were there were small messages as well. The challenge were the queues and the connections, but more the queues.
Fewer nodes is best
How do you scale Rabbit? You just add more nodes, right? Well, maybe not. Actually, fewer nodes is best. There are a few reasons for it. Every node in the cluster communicates with every other node. the more nodes you add, the chatter between nodes increases a lot but that's not the worst part.
When a node goes away - you have a cluster node that goes away, all the remaining nodes have to clean up the state of that node. They all do it concurrently. There is a to-do that goes way back many years but we're working on it.
The worst part, possibly, is that the RabbitMQ metadata needs to synchronize across all nodes. The more nodes you add, like any operation has to be synchronized in all nodes before, “Yep, it's all good.” These are the RabbitMQ metadata like bindings, queue definitions, exchanges - stuff like that.
This is what your three-node cluster looks like, right. RabbitMQ is a complete graph. Every node talks to every other node. It looks very nice.
This is what happens when you go to seven nodes, right, it looks bad. Criss-crossing. Lots of stuff.
Connections are not free
Connections are not free. They cost memory. It gets worse because machines have more and more memory so, by default, the TCP sockets are using more and more memory. Today, in a typical system, they will use about a 100 KB even if they're not using anything. if you tune this, you can free up many GBs of memory just by tuning this one parameter. You can do this straight from RabbitMQ, by the way. You don't need to go in the kernel.
Are default metrics right for you?
Again, the default metrics keep coming up because you might collect metrics that you don't even care about. There's a lot of pressure on the metric system even though it's better.
Do you need to store all those metrics? Do you need to generate them as often and, again, extract? Same advice as before.
Exchange and Queue type differences
Lastly, you'd think that every exchange and every queue type maybe is fast when it comes to operations. There are differences. for example, if you have to bind a 100,000 queues to exchanges, if the exchange is a topic exchange and if the queue is a durable queue, you will top up around 22 binds/second. This is better now. It gets better all the time. To do 100,000 queues, it will take 75 minutes.
A direct exchange is the fastest and a non-durable queue is fastest. The reason for this being there are less operations in Mnesia. It means that, the same queue binds, you can finish them in six minutes. It's a big difference from 75.
In summary
This is where I wanted to get to - the summary. It's very, very important to know what you're trying to get from RabbitMQ. Because it's so flexible, you can get anything from it. Everything is possible within reason, obviously. But everything is possible. You can go as crazy as you want.
What are you trying to achieve? Is it low latency that you care about? Is it throughput that you care about? What do you care about?
It's important not to mix workloads. If you have a RabbitMQ that's supposed to deliver you low latency and high throughput, that's not going to work. Think about racetracks, like in a race track, cars go as fast as possible. Think about motorways. It's about volume. They're different problems.
Surprisingly, 90% of RabbitMQ issues are down to applications. You wouldn't believe like what a difference a good application or a good client that knows what it's trying to achieve and it's configured for its intended purpose. It makes a huge difference.
How can you help?
Maybe some of you are wondering, “This is great. I want to help.” How can you help? Contribute your observations.
Take a look at the baselines. Wayne mentioned workloads. “What's possible? What's the baseline?” So that we can know. Like, Is your environment worse? Are you doing something bad? Are we improving things? Are things getting worse or better in RabbitMQ? We hope. It's important to know what the starting point is.
Tell us about your workload. I'm sure you have workloads that we haven't heard about. Maybe, you haven't even thought about this.
Maybe durability, the most important thing. Hence, quorum queues. What metrics are important? We would like to know, when it comes to tuning different things or running different workloads. Which metrics do you wish you had in RabbitMQ? We can make some assumptions but we would like your input.
I think we have a few more minutes for questions either to myself or Wayne. Thank you.
[Applause]
Questions from the audience
What's your minimum node count in RabbitMQ broker cluster, with High Availability? Two is enough or should I start with three?
I would say three. I would say three because pause minority. And quorum queues, they require three nodes.
It was mentioned to not use multi Availability Zones in a cluster. I do so fairly heavily across multiple queues with high velocity throughputs. I was wondering what kind of scenarios you see where people are running into partition issues. Is it a traffic issue? Is it a cloud provider issue? Because I haven't seen it.
I think we would find it's a cloud provider issue because clusters require low latency for the heartbeat between the nodes. Oftentimes, it's not fast enough when you spread that across Availability Zones and, say, AWS. That's where I’ve run into it a lot.
We talk about the concept of AZ's from a PCF perspective and AZ's from the cloud perspective. They're not always talking about the same concepts. It's really important to understand what they do. And if they get physically distributed, just the time to pass the heartbeats between the nodes is not sufficient. And so, RabbitMQ will get confused and think it's in a split-brain scenario when it was just a latency issue with the heartbeat.
Yeah, I've run into it even when it wasn't Pivotal Cloud Foundry, when they were just running on straight AWS.
Coming back on this multi-AZ set up, what kind of partition handling mode were you using? Were you successfully using pause minority across Availability Zones?
It was. The default policy for PCF is pause minority. They don't have to select that but that generally is what we see customers do because that's the default from our configuration.
There were some very nice charts in this presentation. How can RabbitMQ users adopt this kind of awesome monitoring and generate all those charts? Can you please tell us more about it?
That’s such a leading question. Thank you, Michael. Thank you. The client charts, when it comes to message latency perf tests since 2.2.0, has native support with Prometheus as well as others. It's using micrometer so it's able to expose a lot of metrics internally about the client via micrometer. When it comes to RabbitMQ, there's a plugin - a third-party plug-in, community plug-in, Prometheus RabbitMQ exporter. We haven't seen any charts here but it's another good way of getting those metrics in Prometheus if you use that.
The charts that you've seen at the very beginning, they are Grafana. There's a dashboard. I mentioned that it's public. You can see more details here. You can see the link to the actual dashboard. That's a low latency one.
We have a few others. We have one which basically tracks the Erlang memory allocations and memory allocators. It’s very detailed. It's part of being dashboards. There are a few others which we haven't made public yet but we're slowly getting there.