Prometheus
To enable the Prometheus plugin, from the CloudAMQP Console go to Plugins and
enable rabbitmq_prometheus. When enabled, metrics will be exposed on the /metrics
endpoint - for example
https://[HOST]/metrics
Metrics are exposed in the following format:
# TYPE rabbitmq_connections_opened_total counter
# HELP rabbitmq_connections_opened_total Total number of connections opened
rabbitmq_connections_opened_total 2
# TYPE rabbitmq_connections_closed_total counter
# HELP rabbitmq_connections_closed_total Total number of connections closed or terminated
rabbitmq_connections_closed_total 11
Connections, channels and queue metrics are aggregated by default.
If you want metrics per object (i.e. for each queue) this can be achieved by using the
/metrics/detailed
By default it doesn't return anything, but it's possible to specify required metric groups and virtual host filters in the GET-parameters.
For example, scraping
https://[HOST]/metrics/detailed?vhost=vhost-1&vhost=vhost-2&family=queue_coarse_metrics&family=queue_consumer_count
will only return requested metrics.
The returned metrics use a different prefix rabbitmq_detailed_, instead of rabbitmq_ used by other endpoints, so that endpoint can be used simultaneously with /metrics.
The detailed endpoint supports the following parameters:
- Zero or more 'family' - only the requested metric families will be returned.
- Zero or more 'vhost' - if it's given, queue related metrics (queue_coarse_metrics, queue_consumer_count and queue_metrics) will be returned only for given vhost(s).
All available values are documented at the rabbitmq-server repository.
If you know what you are doing, and want detailed metrics for all objects, you can use
/metrics/per-object
which will return everything. If you have a lot of object there will be a lot of data and CPU usage to deliver this.
Getting started
Before you get started, we recommend reviewing the Prometheus documentation here.
We also recommend that you install Prometheus on a separate server to your CloudAMQP instance. After the installation of Prometheus, you need to change a couple of values in the prometheus.yml file. The following is an example configuration file with recommendations:
# global config
global:
  scrape_interval: 15s # Set the scrape interval to every 15 seconds. Default is every 60 seconds
  scrape_timeout: 15s  # How long until a scrape request times out. Default is 10 seconds

# A list of scrape configurations.
scrape_configs:
  # The job name assigned to scraped metrics by default.
  - job_name: 'cloudamqp'
    basic_auth:
      username: 'USERNAME'
      password: 'PASSWORD'
    scheme: https #necessary for cloudamqp instances
    # metrics_path defaults to '/metrics', which is the one used by cloudamqp instances so no need to define.
    # static_configs allows specifying a list of targets and a common label set for them.
    static_configs:
    - targets: ['your-host-01.rmq.cloudamqp.com', 'your-host-02.rmq.cloudamqp.com']

  # Similar job as above, but for detailed metrics
  - job_name: 'cloudamqp-detailed'
    basic_auth:
      username: 'USERNAME'
      password: 'PASSWORD'
    scheme: https
    # metrics_path needs to be specified for detailed metrics
    metrics_path: "/metrics/detailed"
    # family parameters specifying what detailed metrics to be available
    # https://github.com/rabbitmq/rabbitmq-server/blob/master/deps/rabbitmq_prometheus/metrics-detailed.md
    params:
      family:
        - "queue_metrics"
        - "channel_metrics"
    # static_configs allows specifying a list of targets and a common label set for them.
    static_configs:
    - targets: ['your-host-01.rmq.cloudamqp.com', 'your-host-02.rmq.cloudamqp.com']
Those of you running multi-node clusters should make sure you are targeting each node in the cluster, as the example shows. For more ways to configure Prometheus, read the documentation here.
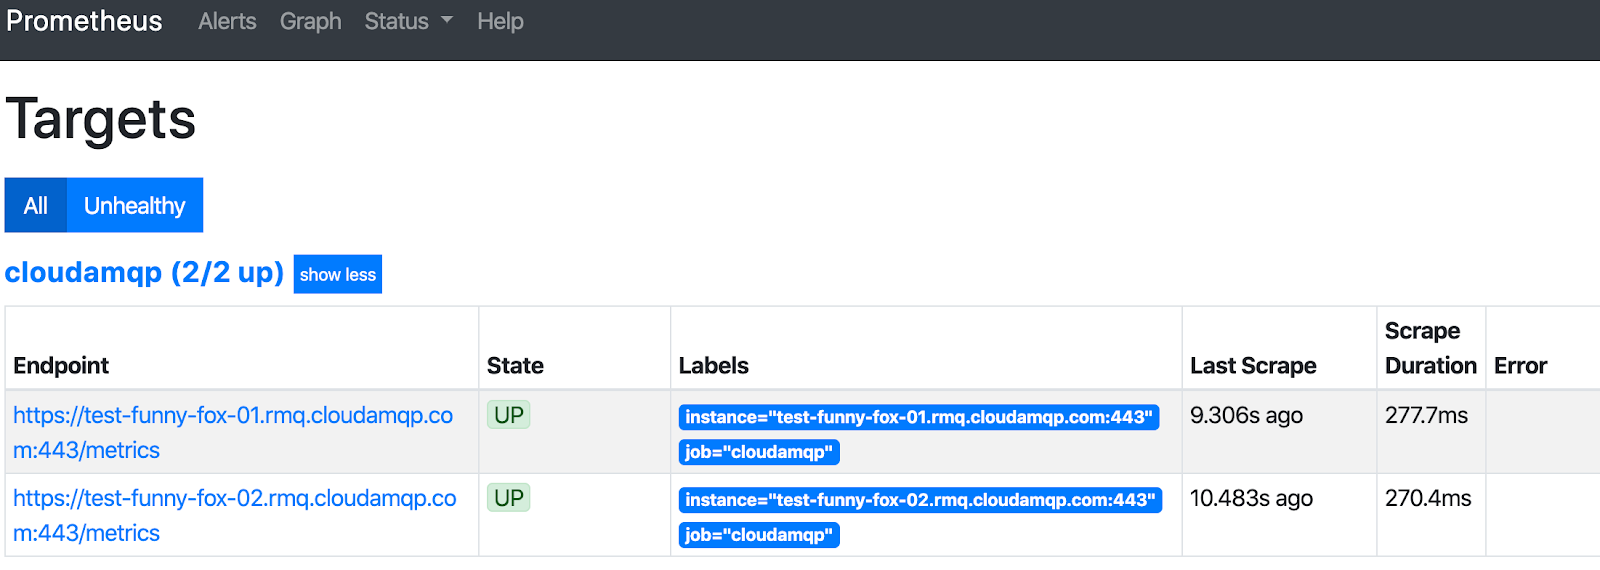
After starting Prometheus, review the targets to make sure they are running without errors.
If you are having issues, Prometheus can be started with the option
--log.level=debug
for debugging.
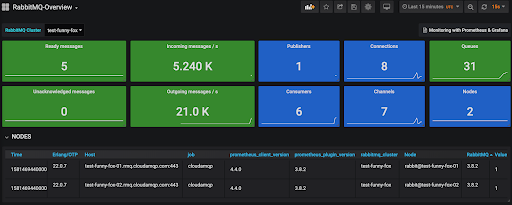
Grafana
For metrics visualization, install Grafana on a separate server to your CloudAMQP instance. Either download or get a hosted version of Grafana here.
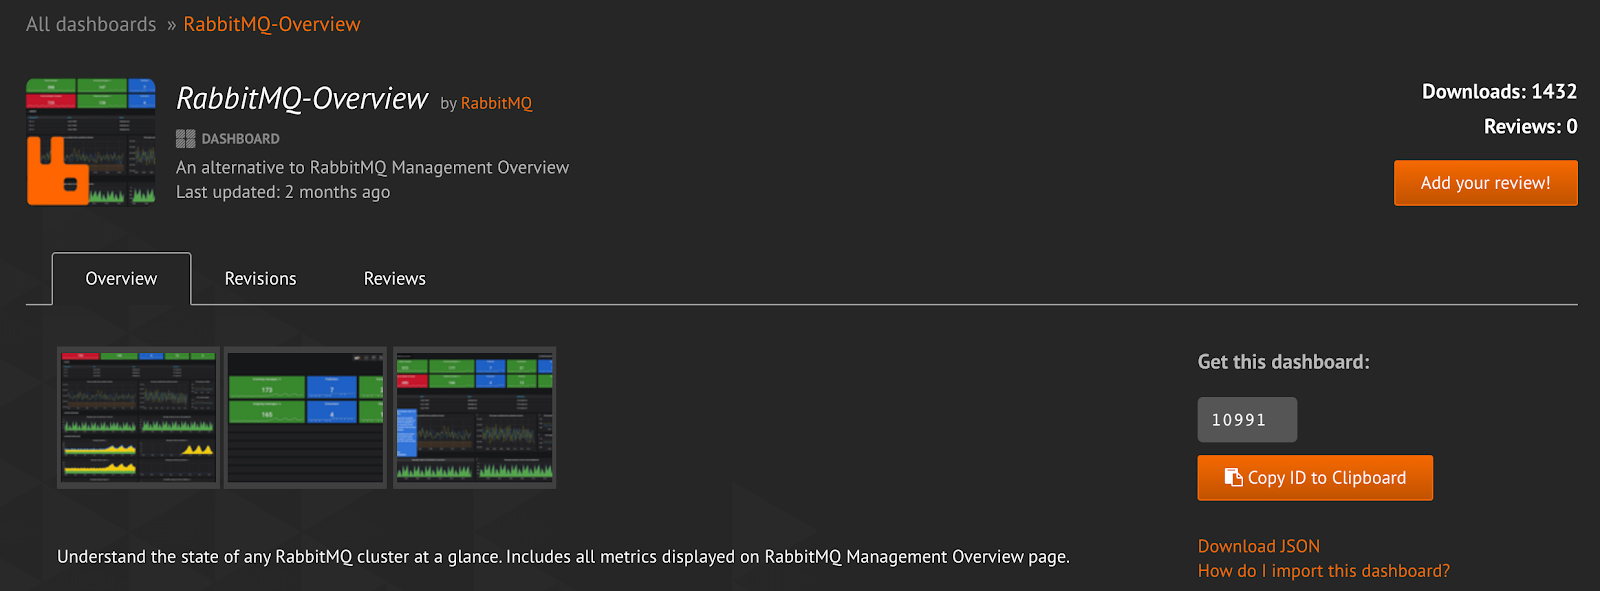
The RabbitMQ core team has created a number of dashboards that can be imported,
including those found
here.
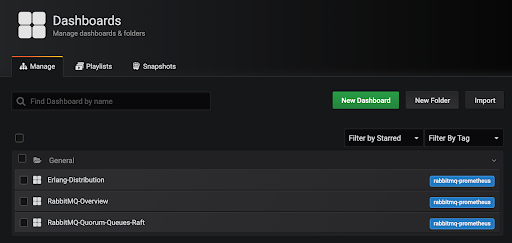
To import a dashboard, follow
these steps.
More information from RabbitMQ can be found here.
Feel free to contact us at support@cloudamqp.com if you have any suggestions or feedback.