Decentralized observability with OpenTelemetry, Part 3
In Part 1 we explained why we rebuilt our metrics system, and in Part 2 we covered the logs migration. This post dives into the technical implementation: building our custom OpenTelemetry Collector distribution, the full system architecture, and the results we achieved.
Building our custom distribution
OpenTelemetry provides a builder tool that makes creating custom distributions straightforward. We created a builder manifest specifying exactly which components we needed:
receivers:
  - gomod: github.com/open-telemetry/opentelemetry-collector-contrib/receiver/prometheusreceiver v0.132.0
  - gomod: github.com/open-telemetry/opentelemetry-collector-contrib/receiver/hostmetricsreceiver v0.132.0
  - gomod: github.com/open-telemetry/opentelemetry-collector-contrib/receiver/journaldreceiver v0.132.0

processors:
  - gomod: go.opentelemetry.io/collector/processor/batchprocessor v0.132.0
  - gomod: github.com/open-telemetry/opentelemetry-collector-contrib/processor/filterprocessor v0.132.0
  - gomod: github.com/open-telemetry/opentelemetry-collector-contrib/processor/attributesprocessor v0.132.0
  - gomod: go.opentelemetry.io/collector/processor/memorylimiterprocessor v0.132.0
  - gomod: github.com/open-telemetry/opentelemetry-collector-contrib/processor/resourceprocessor v0.132.0
  - gomod: github.com/open-telemetry/opentelemetry-collector-contrib/processor/transformprocessor v0.132.0
  - gomod: github.com/open-telemetry/opentelemetry-collector-contrib/processor/cumulativetodeltaprocessor v0.132.0

exporters:
  - gomod: go.opentelemetry.io/collector/exporter/debugexporter v0.132.0
  - gomod: github.com/open-telemetry/opentelemetry-collector-contrib/exporter/datadogexporter v0.132.0
  - gomod: github.com/open-telemetry/opentelemetry-collector-contrib/exporter/prometheusremotewriteexporter v0.132.0
  - gomod: github.com/open-telemetry/opentelemetry-collector-contrib/exporter/awsemfexporter v0.132.0
  - gomod: github.com/open-telemetry/opentelemetry-collector-contrib/exporter/prometheusexporter v0.132.0
  - gomod: go.opentelemetry.io/collector/exporter/otlphttpexporter v0.132.0
  - gomod: github.com/open-telemetry/opentelemetry-collector-contrib/exporter/rabbitmqexporter v0.132.0
  - gomod: github.com/open-telemetry/opentelemetry-collector-contrib/exporter/googlecloudexporter v0.132.0
  - gomod: github.com/open-telemetry/opentelemetry-collector-contrib/exporter/splunkhecexporter v0.132.0
  - gomod: github.com/open-telemetry/opentelemetry-collector-contrib/exporter/azuremonitorexporter v0.132.0
  - gomod: github.com/open-telemetry/opentelemetry-collector-contrib/exporter/coralogixexporter v0.132.0

extensions:
  - gomod: github.com/open-telemetry/opentelemetry-collector-contrib/extension/encoding/otlpencodingextension v0.132.0
  - gomod: github.com/open-telemetry/opentelemetry-collector-contrib/extension/basicauthextension v0.132.0
  - gomod: github.com/open-telemetry/opentelemetry-collector-contrib/extension/pprofextension v0.132.0
The Prometheus receiver collects broker metrics, the hostmetrics receiver gathers server metrics, and the journald receiver captures logs. Processors handle batching, filtering, and attribute management. Multiple exporters enable support for various observability platforms including Grafana Mimir, Datadog, AWS CloudWatch, Google Cloud, Splunk, Azure Monitor, and Coralogix.
System architecture
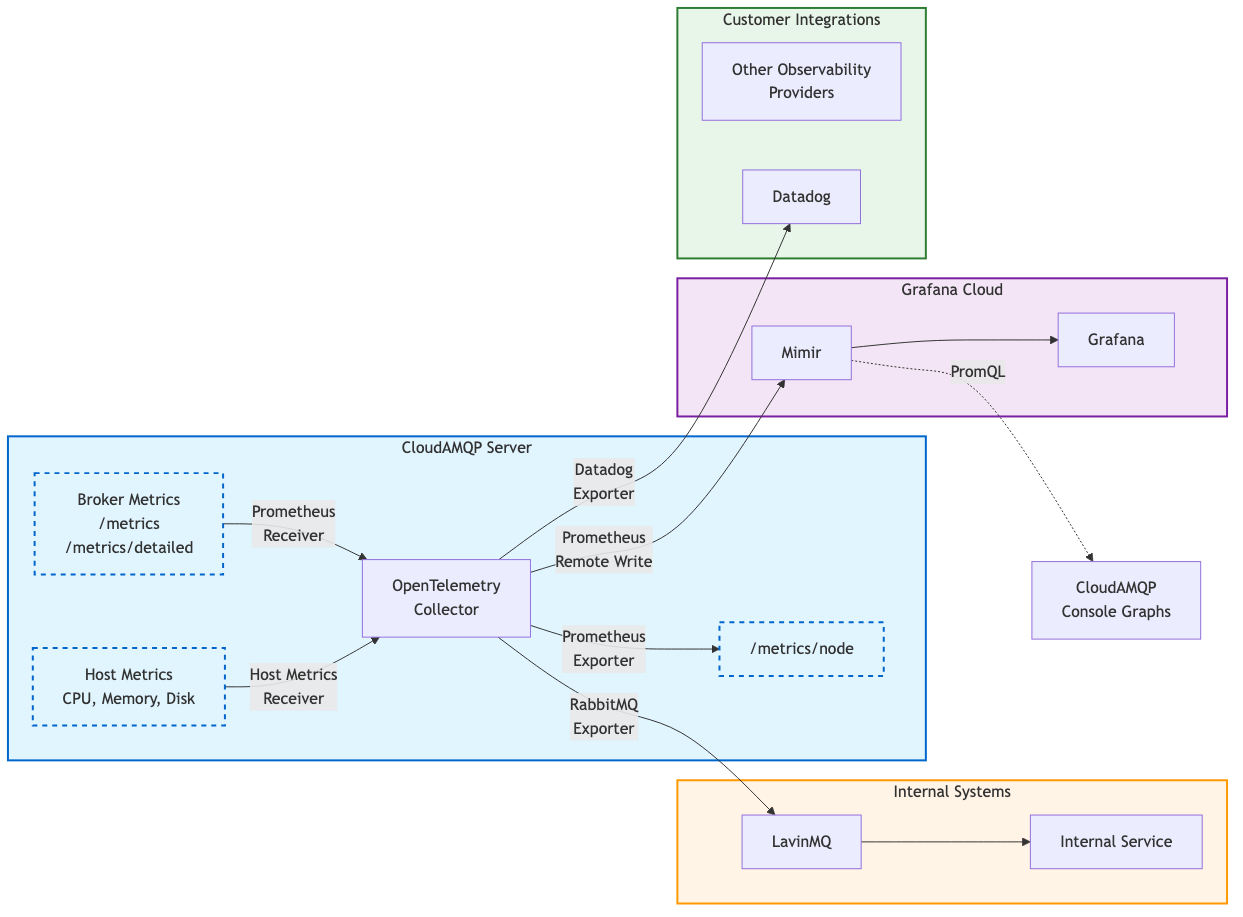
Each server in our fleet runs its own OpenTelemetry Collector instance. The collector scrapes metrics from two broker endpoints:
/metrics
for aggregated metrics (sums metrics across objects like vhosts, connections, queues) and
/metrics/detailed
for per-object metrics. The hostmetrics receiver collects server metrics like CPU, memory, disk, and the journald receiver captures system logs.

Data flows from collectors to multiple destinations simultaneously:
- Internal observability: Metrics flow to our Grafana Cloud Mimir instance for long-term storage and visualization. We query Mimir using PromQL from both Grafana dashboards and our API for displaying graphs in the CloudAMQP console.
- Internal systems: Collectors export metrics to our internal LavinMQ instance using the RabbitMQ exporter. Several services consume from this broker, including an alarms service that evaluates alarm conditions and notifies customers.
- Customer integrations: When customers configure metrics integrations, collectors export directly to their chosen observability platform using vendor-specific exporters (Datadog, CloudWatch, etc.).
-
Direct access:
The Prometheus exporter makes metrics available at
/metrics/nodeon each server, allowing customers to scrape metrics directly from their CloudAMQP server.
For logs, collectors send data to Grafana Loki using the OpenTelemetry Protocol (OTLP). We query logs using LogQL in Grafana's log explorer and use them for alerting rules that notify our team via Slack and PagerDuty.

This architecture eliminates the central bottleneck of our legacy system. Each collector operates independently, so if one fails, it only affects that specific server rather than the entire fleet.
Dynamic configuration
Each server runs the OpenTelemetry Collector with a custom JSON configuration file. We generate these configurations dynamically in Ruby based on:
- Cloud provider, region, and CloudAMQP plan
- Customer-enabled integrations
- Desired metrics collection settings
When a customer configures a new metrics integration or changes settings, we rebuild the configuration and push it to the server.
Here's a simplified example of a collector configuration that only scrapes Prometheus metrics from a RabbitMQ broker and exports them to Grafana Mimir:
{
  "receivers": {
    "prometheus/broker": {
      "config": {
        "scrape_configs": [
          {
            "job_name": "rabbitmq",
            "scrape_interval": "60s",
            "static_configs": [
              {
                "targets": ["localhost:15692"]
              }
            ]
          }
        ]
      }
    }
  },
  "processors": {
    "attributes/instance": {
      "actions": [
        {
          "key": "instance",
          "value": "server-name-01",
          "action": "insert"
        }
      ]
    }
  },
  "exporters": {
    "prometheusremotewrite/mimir": {
      "endpoint": "https://prometheus-prod-example.grafana.net/api/prom/push",
      "auth": {
        "authenticator": "basicauth/mimir"
      }
    }
  },
  "service": {
    "pipelines": {
      "metrics/broker": {
        "receivers": ["prometheus/broker"],
        "processors": ["attributes/instance"],
        "exporters": ["prometheusremotewrite/mimir"]
      }
    }
  }
}
Results
Trade-offs
The decentralized approach requires:
- A service to manage collector configuration on each server
- Monitoring to ensure collectors remain operational
- Regular updates to our custom distribution (new versions are released frequently with occasional breaking changes)
- Using customer server resources for metrics and logs collection
However, resource usage is modest. The collector averages 90 MiB of memory, peaking at 166 MiB. This represents under 4% of available memory on our smallest plans and less than 0.1% on our largest. CPU usage peaks at around 1%.
Advantages
The benefits far outweigh the costs:
- Dynamic resource scaling: Each server gets its own collector, eliminating central bottlenecks
- Risk diversification: No single point of failure for the entire observability system
- Reduced latency: Metrics flow directly from brokers to their destinations without intermediate hops
- Open standards: No vendor lock-in, easy to switch storage or visualization tools
- Flexible integration support: Customers can send metrics to any Prometheus-compatible backend
-
Direct server metric access:
Customers can scrape metrics directly from the
/metrics/nodeendpoint - Easy extensibility: Adding metrics or integrations no longer requires rebuilding data pipelines
Summary
We built a custom OpenTelemetry Collector distribution tailored to our needs, with receivers for Prometheus metrics, server metrics, and logs. The decentralized architecture places a collector on each server, eliminating central bottlenecks and reducing latency. Dynamic configuration allows us to manage integrations per-customer without service disruption.
The results speak for themselves: better scalability, lower latency, easier integration support, and no vendor lock-in. For teams managing large fleets or providing observability as a feature, the combination of decentralization and open standards offers a path to a more scalable and maintainable system.
If you have questions about our implementation or want to discuss observability challenges, reach out to us at contact@cloudamqp.com


