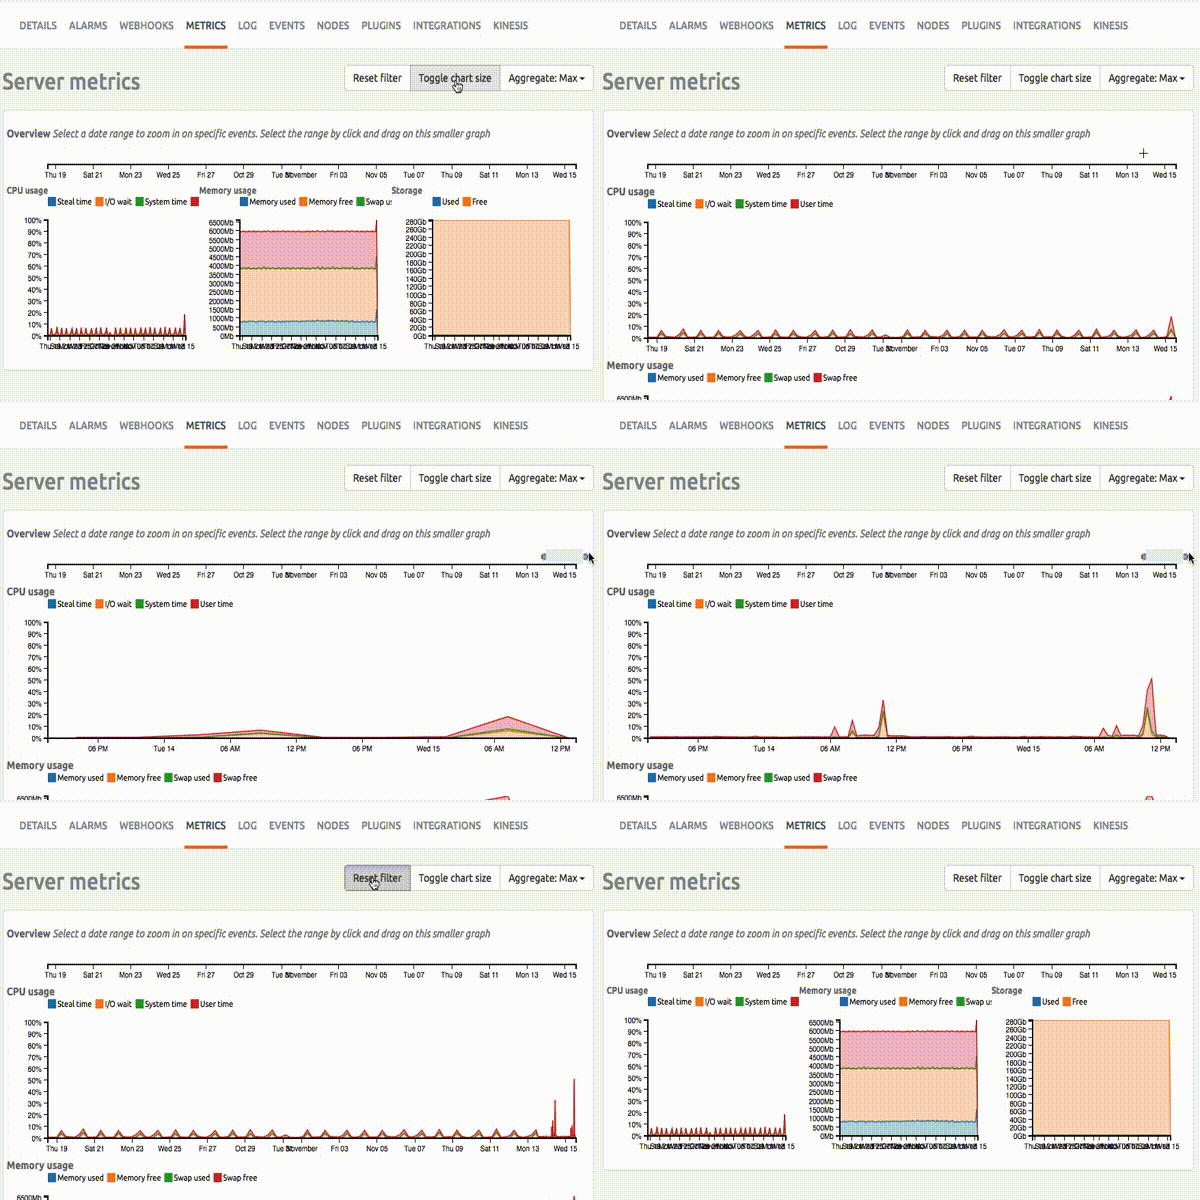
To keep full tracks of your instances over time, we have now upgraded our
graph metrics. The new graphs will help you while debugging your instance.
For years, we have seen different reasons for crashed or unresponsive RabbitMQ instances. Too many queued messages and too many channels or connections, have been the most common reasons for high CPU usage. To protect against, and to help identify issues, we now have upgraded our CloudAMQP control panel to help you keep full track of your instances well being over time. You will now be able to view the frequency of your instance messages, channels and connections, both present and historically.
Why we added it
The feature gives you the opportunity to monitor your cluster, not only in real time but also historically, which provides you with insight into how your cluster actuate data. By that, you can track and trace any laps your system might have encountered in the past. The new graphs show you, among other data, the number of connections and messages for your instance both in the present and in the past. This way you can see if the number of messages matches with an increasing CPU, and then find out why your system is affected, for example, by steal time or other issues. The feature enables you to trace information about your system, like if the memory or CPU increases and if it depends on the number of connections, or un-acked messages, etc. This additional tool allows you to oversee that your instance is handling data as you wish and by that giving you the ability to fix and track issues before causing damage to your instance.Zoom to specify your search
An additional feature in the form of a zoom will help you to define a specified time interval further. By simply selecting and dragging the mouse pointer you can zoom in on the time interval that you want to check more closely. This feature allows you to view more high definition data in a shorter time range and track spikes that are not otherwise visible. For example, if the CPU has gone up quickly but very shortly.Example:
“You experienced that some of your connection timed out on the third of november, by looking in the graphs and zooming in on just that day you could identify a rise on steal time”

Please email us at contact@cloudamqp.com if you have any suggestions, questions or feedback.


