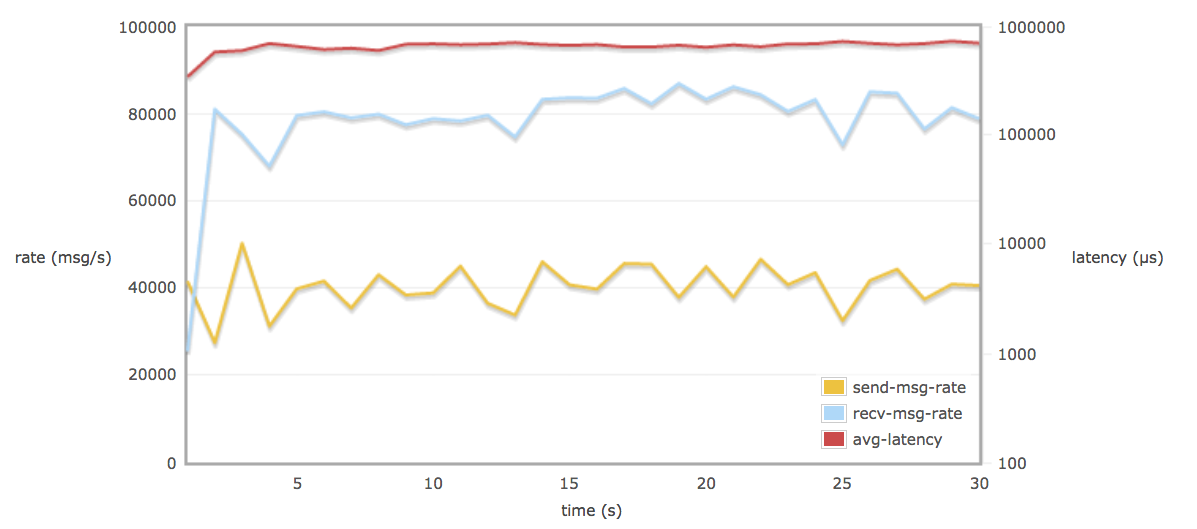
Load testing is always good to perform during development of a product. It's even more important near completion of your project, when you know exactly which type of routing you are using, when you know message size, when you know if you are using auto-ack, if you publish with confirmation or not etc. You might also test how different servers are acting in different datacenters and with different number of nodes.
Benchmark testing with RabbitMQ's Java Client Tools - PerfTest
This can be tested by using RabbitMQ's Java Client Tools which comes with PerfTest: https://www.rabbitmq.com/client-libraries/java-tools
PerfTest is a performance testing tool. It starts up zero or more producers and consumers and reports the rate at which messages are sent and received, along with the latency (i.e. time taken for messages to pass through the broker).
To get your benchmark environment up an running quickly, I recommend you to download the RabbitMQ Java client from here.
PerfTest supports many command line flags. When the tool is downloaded, you can simply run the benchmark commands in your console with different parameters specified, like in the example below where we are running on 10 consumers and 5 producers with autoack on our server, exported into $uri.
$ export uri=amqp://user:pass@host/vhost
$ rabbitmq-perf-test-1.2.0/bin/runjava.sh com.rabbitmq.perf.PerfTest --uri $uri --consumers 10 --producers 5 --autoack
time: 66.052s, sent: 50769 msg/s, received: 604884 msg/s, min/avg/max latency: 2320403/2977505/3552331 microseconds
time: 67.052s, sent: 58664 msg/s, received: 616624 msg/s, min/avg/max latency: 2306339/2759197/3507812 microseconds
time: 68.052s, sent: 64261 msg/s, received: 617090 msg/s, min/avg/max latency: 2189480/2731328/3166852 microseconds
time: 69.052s, sent: 65532 msg/s, received: 630438 msg/s, min/avg/max latency: 2208464/2738753/3206709 microseconds
Invoke --help to see all option you can specify in your test. Some of them are listed below
$ rabbitmq-perf-test-1.2.0/bin/runjava.sh com.rabbitmq.perf.PerfTest --help
 usage: <program>
 -?,--help                    show usage
 -a,--autoack                 auto ack
 -e,--exchange 	<arg>          exchange name
 -f,--flag <arg>              message flag
 -h,--uri <arg>               AMQP URI
 -K,--randomRoutingKey        use random routing key per message
 -k,--routingKey <arg>        routing key
 ....
 ....
 -s,--size <arg>              message size
 -t,--type <arg>              exchange type
 -u,--queue <arg>             queue name
 -x,--producers <arg>         producer count
 -y,--consumers <arg>         consumer count
HTML Performance Tools
The HTML Performance Tools are a set of tools that can help you run automated benchmarks. In that tool, you can provide benchmark specs, and the tool will take care of running the benchmark, collecting results and displaying them in an HTML page.
When using HTML Performance Tools you need to provide an input file for you test case.
[{'name': 'CloudAMQP Example', 'type': 'simple', 'uri': 'amqp://user:pass@host/vhost', 'params':[{'time-limit': 10, 'producer-count': 4, 'consumer-count': 2}]}]$ rabbitmq-java-client-bin-3.5.7/runjava.sh com.rabbitmq.examples.PerfTestMulti spec-file.js result-file.jsYour results will afterwords be collected in the given result file and this file can be used as input and printed in a simple way on a webpage. I recommend you to take a look at the example code provided in here.

Let us know if you need any help or have any questions about performance measurements in RabbitMQ.


