This is a living document that is continually updated. Last updated February 2026.
Over the years, we have seen many different reasons for crashed or unresponsive CloudAMQP/RabbitMQ servers. Large message backlogs, sustained high message throughput, and frequently opened and closed connections are among the most common causes of high CPU and memory usage. To help prevent these issues, CloudAMQP provides tools that allow you to detect performance problems early and act before they affect your users
As a first step, we strongly recommend enabling CPU and memory alarms in the control panel for all dedicated plans. These alarms notify you when resource usage reaches or exceeds a configured threshold for a certain duration. The default threshold for both CPU and memory is 90%, but this can be adjusted at any time. Read more about alarms in the monitoring documentation.
Troubleshooting RabbitMQ
Below are general tips and tools to keep in mind when troubleshooting a RabbitMQ server that is experiencing performance or stability issues.
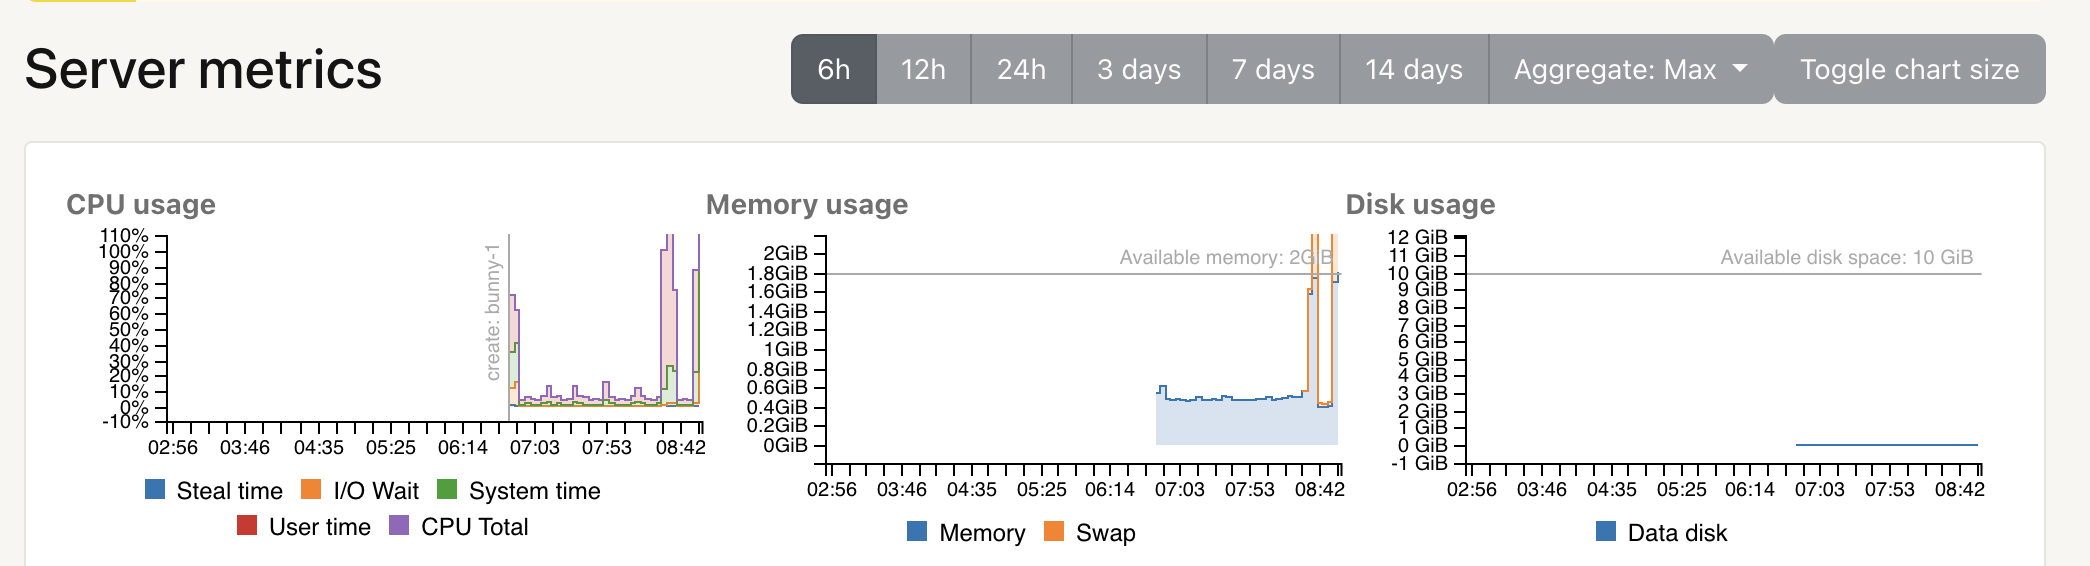
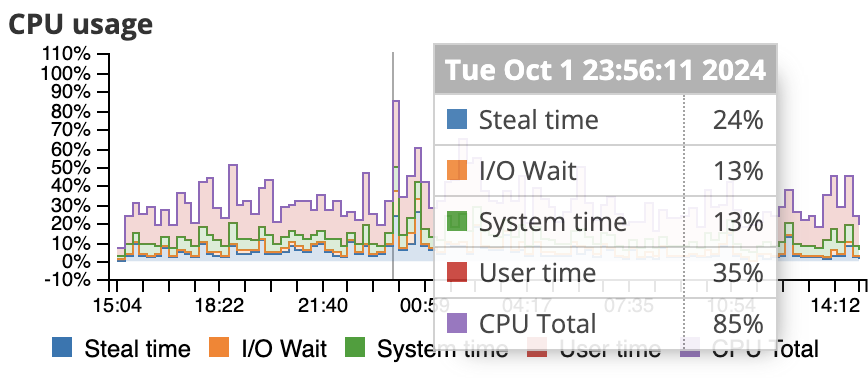
Server metricsServer Metrics provide insight into how your instance is performing over time. CloudAMQP exposes CPU usage, memory usage, disk usage, and other key indicators. Are there CPU or memory spikes? Do they correlate with a specific time of day or a recent deployment? Did you change anything in your application around that time?
 RabbitMQ Management interface
If the RabbitMQ management interface is accessible, start there. Check that everything looks reasonable — from the number of queues and channels to message rates and queue depths.
RabbitMQ Logs
Logs for all nodes in a cluster can be downloaded via the
/logs
endpoint. Look for new or unfamiliar errors that might indicate
resource exhaustion or misbehaving clients.
Most common errors/mistakes
Below is a list of the most common issues we see on misbehaving clusters, along with their typical root causes and recommendations for preventing or resolving them.
- Too many queued messages
- Too high message throughput
- Too many queues
- Frequently opening and closing connections
- Connection or channel leak
1. Too many queued messages
Short queues are the fastest queues. When a queue is empty and consumers are ready to receive messages, messages are delivered immediately without additional overhead.
In older RabbitMQ versions, classic queues buffered most messages in memory. If messages arrived faster than consumers could process them, memory usage would grow until RabbitMQ was forced to page messages to disk. Paging significantly increases CPU usage and I/O wait, and often leads to degraded performance across the entire cluster.
With RabbitMQ 3.10, Classic Queues v2 were introduced, and from RabbitMQ 3.12 onward both v1 and v2 default to writing most messages directly to disk, keeping only a small working set in memory. This greatly reduces the risk of memory exhaustion.
- For optimal performance, queues should stay close to zero.
- Are you running an older RabbitMQ version? Upgrading to RabbitMQ 3.13 or later is strongly recommended. If upgrading is not possible, consider using lazy queues Stopping the stampeding herd problem with lazy queues to minimize memory usage, keeping in mind that disk I/O will increase.
- Are your consumers connected? Consumer alarms can help detect stalled or disconnected workers.
- Too many unacknowledged messages: Unacknowledged messages must remain in memory. Limiting consumer prefetch is an effective way to control memory usage.
We recommend enabling queue length alarms or setting a max-length or max-ttl policy on queues where possible.
If you already have too many messages in the queue - you need to start consuming more messages or get your queues drained. If you are able to turn off your publishers then do that until you have managed to consume the messages from the queue.
2. Too high message throughput
High CPU user time often indicates that RabbitMQ is spending most of its time processing messages. Sustained throughput near or above the capacity of the underlying instance can lead to throttling and steal time.
Dedicated plans are not artificially limited; performance depends on the selected instance type. Each plan has an approximate burst capacity, but sustained load beyond that point will reduce overall throughput.

Most of our benchmark tests are done with RabbitMQ PerfTest tool with one queue, one publisher and one customer. Durable queues/exchanges have been used and transient messages with default message size have been used. There are a lot of other factors too that plays in, like the type of routing, if you ack or auto-ack, datacenter, if you publish with confirmation or not etc. If you, for example, are publishing large persistent messages, it will result in a lot of I/O wait time for the CPU. Read more about Load testing and performance measurements in RabbitMQ. You need to run your own tests to ensure the perfomance on a given plan.
If your cluster is experiencing high CPU usage, here are some action points.
- Decrease the average load or upgrade/migrate: When you have too high message throughput you should either try to decrease the average load, or upgrade/migrate to a larger plan. If you want to rescale your cluster, go to the CloudAMQP Control Panel, and choose edit for the instance you want to reconfigure. Here you have the ability to add or remove nodes, and change plan altogether. More about migration can be found in: Migrate between plans
- Python Celery: CloudAMQP has long advised against using mingling, gossip, and heartbeats with Python Celery. Why? Mainly because of the flood of unnecessary messages they introduce. You can disable it by adding --without-gossip --without-mingle --without-heartbeat to the Celery worker command line arguments and add CELERY_SEND_EVENTS = False to your settings.py. Take a look at our Celery documentation for up to date information about Celery Settings.
3. Too many queues
Each queue consumes memory and metadata resources. Large numbers of queues also increase the load on the management database. Sudden growth in queue count often indicates a queue leak.
- Use queue TTLs: Automatically clean up unused or abandoned queues.
- Connections and channels: Each connection consumes memory, especially when TLS is enabled.
4. Frequently opening and closing connections
High CPU system time is often a sign that connections are being created and destroyed too frequently.
Connections are expensive; channels are not. Best practice is to keep connections long-lived and reuse them across threads using channels. Ideally, each process should use a single connection.
If many short-lived connections are unavoidable, the CloudAMQP team can help tune TCP settings, or you can use the AMQP proxy to pool connections.

5. Connection or channel leak
A steadily increasing number of connections or channels is usually caused by a leak in client code. Ensure that channels and connections are always closed when no longer needed. Connection alarms can help catch these issues early.
Proactive monitoring with CloudAMQP alarms
The most resilient systems are not only well configured — they are well monitored. Many of the issues described in this article can be detected early using CloudAMQP’s built-in alarm system.
- Infrastructure alarms: Monitor CPU, memory, and disk usage. We recommend setting warning thresholds around 80% to allow time to act before resource limits are reached.
- Queue-specific alarms: Track queue length to detect slow consumers and monitor consumer count to catch crashed workers.
- Connection alarms: Set limits on connection counts to quickly identify leaks.
Alarms can be configured from the Alarms section in the CloudAMQP Control Panel, where you can choose how notifications are delivered. For critical workloads, automatic actions such as upgrades can also be configured when certain thresholds are reached.
We value your feedback and welcome any comments you may have!
This is a list of the most common errors we have seen during years - let us know if we missed something obvious that often has happened to your servers. As always, please email us at contact@cloudamqp.com if you have any suggestions or feedback.