CloudAMQP Metrics
This feature is available on dedicated instances
Metrics show the performance of your server, including:
- CPU
- Memory
- Disk
- Network
It also includes RabbitMQ metrics such as:
- Connections
- Channels
- Consumers
- Queues
- Number of messages
- Connection churn
- Channel churn
- Queue churn
- Message rates
Metrics can be viewed in different time intervals, from 6 hours up to 14 days. You can choose to view the minimum, mean, or maximum aggregated values. Toggle the chart size to minimize and maximize the graphs.
Prometheus Metrics Scraping
Prometheus metrics are available on dedicated instances running RabbitMQ 3.8.0 or newer. New instances will have the
rabbitmq_prometheus
plugin enabled by default, which is required. The following endpoints are available:
/metrics— standard aggregated metrics (connections, channels, queues, message rates)/metrics/detailed— per-object metrics, filterable by virtual host and metric family/metrics/per-object— full detail across all objects (more resource-intensive)
Authenticate using HTTP Basic Auth with the credentials shown on the Details page of your instance.
Note about HA clusters:
Metrics are exposed per node. For HA setups, scrape each node individually (
-01
,
-02
,
-03
) and aggregate in your platform.
The endpoints expose data in the standard Prometheus exposition format, so you do not need to run a self-hosted Prometheus instance unless your platform specifically requires one as an intermediary. Any observability platform that can scrape a Prometheus-compatible HTTP endpoint or an OpenTelemetry Collector with a Prometheus receiver can pull from these endpoints directly.
If your platform does not support pull-based scraping, CloudAMQP also offers built-in push integrations for Datadog, New Relic, Dynatrace, CloudWatch, Stackdriver, Splunk, and Azure Monitor. See Metrics Integrations for details.
For a full walkthrough with self-hosted Prometheus and Grafana, see our blog post on Prometheus and Grafana.
CPU Usage
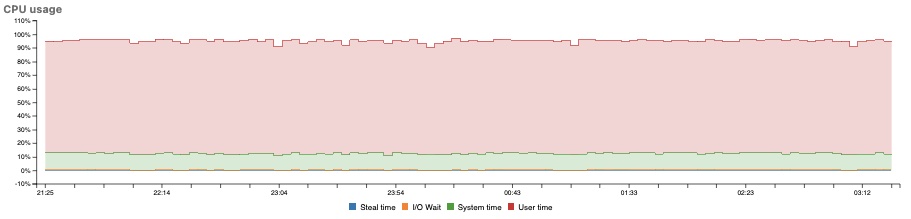
CPU Usage refers to how much work your processor is doing.
-
I/O Wait: This shows the percentage of time spent by the CPU waiting for an IO (input/output) operation to complete. In other words, the percentage of time the CPU has to wait on the disk. If this is high, consider if more messages can be published as transient instead of persistent, or make sure that your queues are short so that messages don’t have to be written to disk. Contact our support if you want to discuss other solutions.
-
User time: This shows the percentage of time your program spends executing instructions in the CPU. In this case, the time the CPU spent running RabbitMQ. If this is high it probably means you are near the limit of what your server can handle. Consider upgrading before the lack of CPU power becomes a serious issue.
-
System time: Describes the percentage of time the CPU spent running OS tasks.
-
Steal time: The percentage of CPU time “stolen” by the virtualization system, or time spent when the virtual CPU waits for a real CPU. If this number is high, it may mean that you are using too much CPU power, which can seriously impact the performance of your server. Upgrade to a larger instance or newer plan if available.
Memory Usage
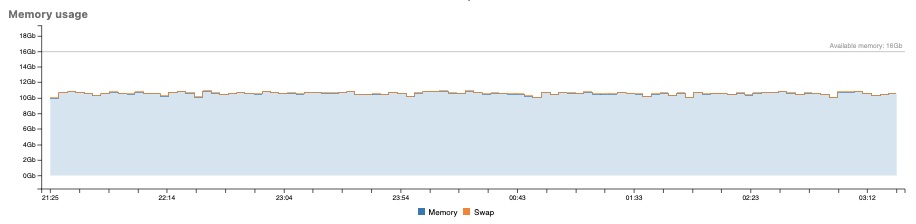
Memory metrics show used and available memory and swap in gigabytes.
Disk usage
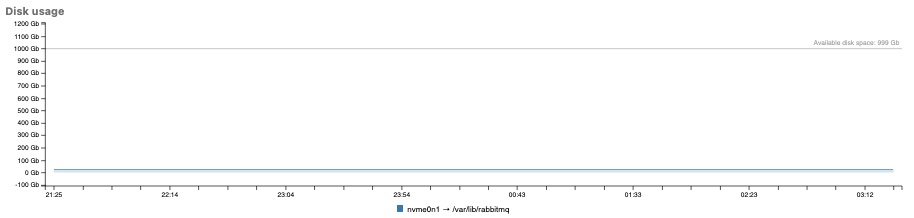
Disk usage show used and available disk size in gigabytes.
Network usage
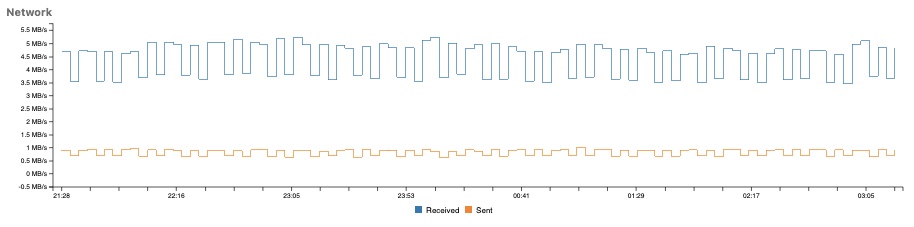
Network received and sent are shown in KBs or MBs.
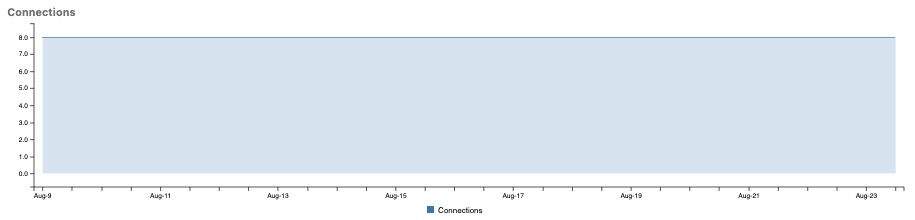
Connections
Showing the number of connections.
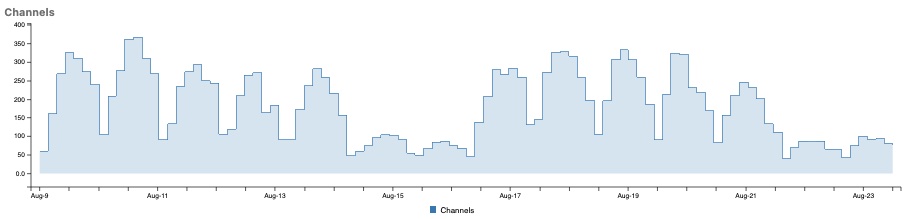
Channels
Showing the number of channels.
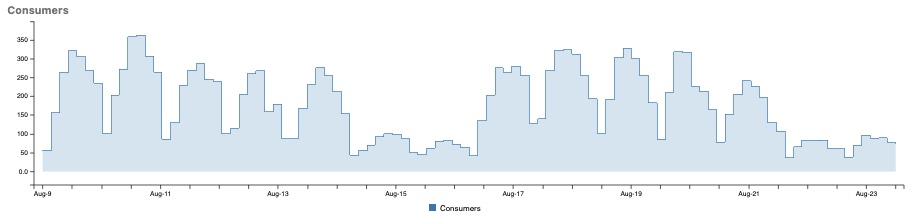
Consumers
Showing the number of consumers.
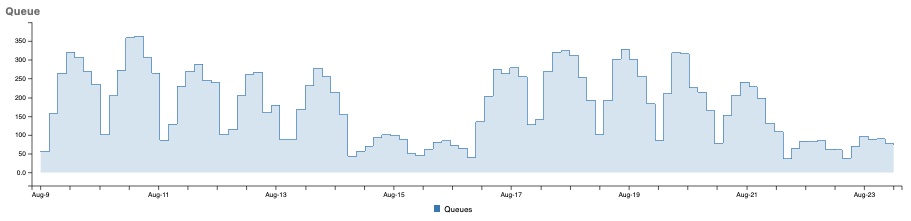
Queues
Showing the number of queues.
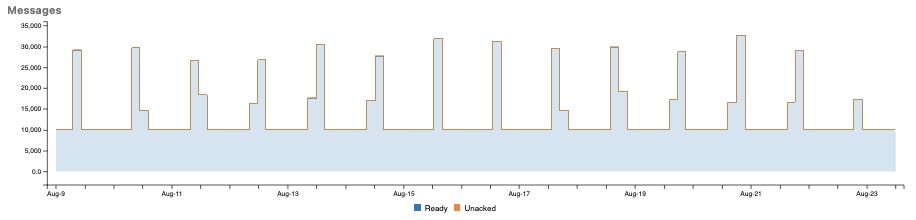
Messages
Showing the number of ready and unacked messages.
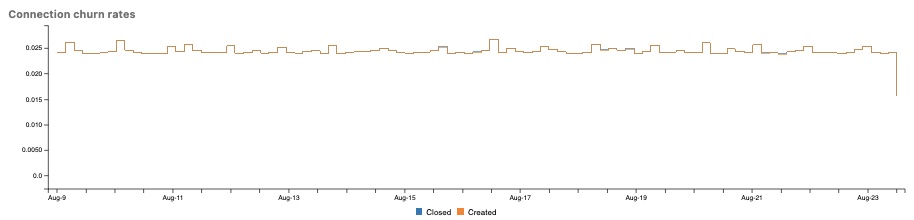
Connection churn rate
Showing the number of created and closed connections.
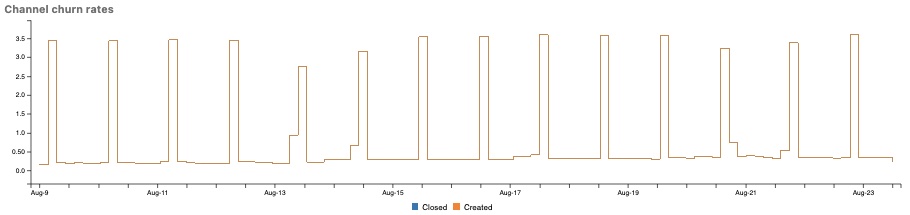
Channel churn rate
Showing the number of created and closed channels.
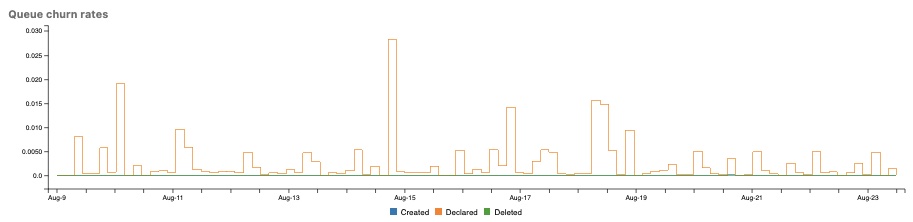
Queue churn rate
Showing the number of created, declared, and deleted queues.
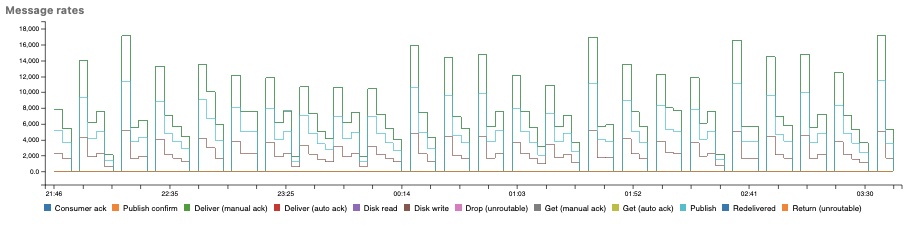
Message rates
Shows rates for consumer acknowledgment, publisher confirm, deliver (manual ack), deliver (auto ack), disk read, disk write, drop (unroutable), get (manual ack), publish, redelivered, return (unroutable)